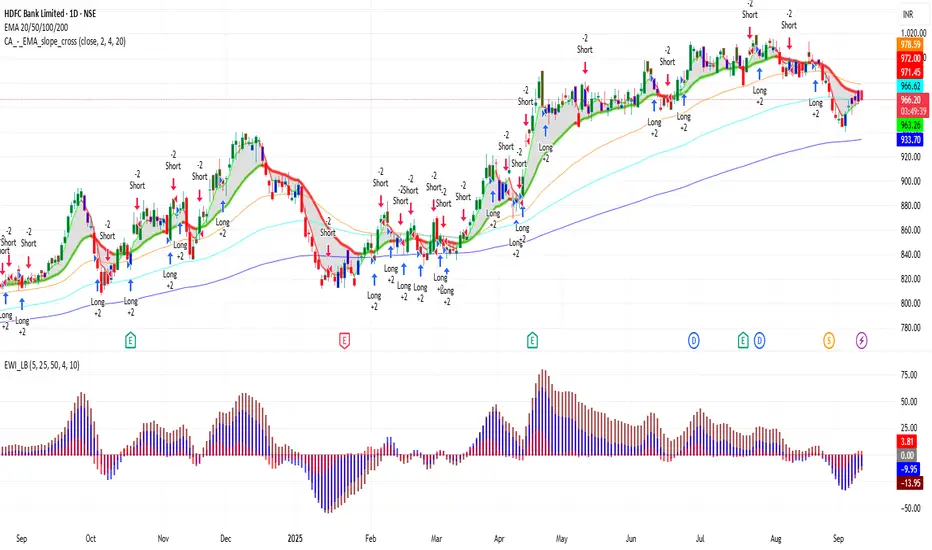
📍 HDFCBANK – 1D Important Levels (Current)
🔹 Support Zones
1,570 – 1,580 → Immediate daily support
1,530 – 1,550 → Strong support; buyers likely to defend this zone
1,480 – 1,500 → Major support; breakdown may shift trend bearish
🔹 Resistance Zones
1,620 – 1,630 → Immediate daily resistance
1,660 – 1,680 → Strong resistance zone
1,720 – 1,740 → Major resistance; breakout here may trigger a bigger rally
⚖️ Daily Trend Outlook
HDFC Bank is currently in a sideways-to-bullish phase on the daily chart.
As long as price holds above 1,570, momentum can stay positive.
A breakout above 1,630 – 1,680 may extend upside towards 1,720 – 1,740.
A breakdown below 1,570 could drag it back to 1,530 – 1,500.
פרסומים קשורים
כתב ויתור
המידע והפרסומים אינם מיועדים להיות, ואינם מהווים, ייעוץ או המלצה פיננסית, השקעתית, מסחרית או מכל סוג אחר המסופקת או מאושרת על ידי TradingView. קרא עוד ב־תנאי השימוש.
כתב ויתור
המידע והפרסומים אינם מיועדים להיות, ואינם מהווים, ייעוץ או המלצה פיננסית, השקעתית, מסחרית או מכל סוג אחר המסופקת או מאושרת על ידי TradingView. קרא עוד ב־תנאי השימוש.