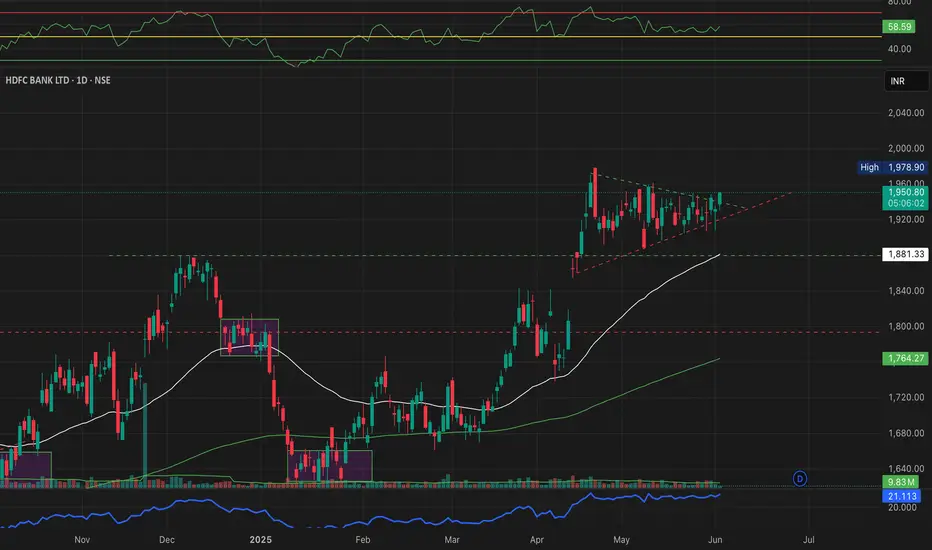
Symmetrical Triangle Tightening With Price Hovering Near Apex. Breakout Looks Imminent.
Price is also above 50 EMA, RSI around 56 - no extreme overbought zone, giving room for movement.
THIS LEVELS ARE PURELY BASED ON MANUAL PRICE ACTION - NO AUTO INDICATORS USED.
Will the triangle break upward or fakeout below? Let's Discuss in the comments!
All Levels hand - marked by Mayur Jayant Takalikar - based on clean structure & momentum zone spotting.
#HDFCBANK #PRICEACTION #TRADINGVIEWINDIA #CHARTANALYSIS #BREAKOUTSETUP #TRIANGLEPATTERN #SUPPORTRESISTANCE
כתב ויתור
המידע והפרסומים אינם מיועדים להיות, ואינם מהווים, ייעוץ או המלצה פיננסית, השקעתית, מסחרית או מכל סוג אחר המסופקת או מאושרת על ידי TradingView. קרא עוד ב־תנאי השימוש.
כתב ויתור
המידע והפרסומים אינם מיועדים להיות, ואינם מהווים, ייעוץ או המלצה פיננסית, השקעתית, מסחרית או מכל סוג אחר המסופקת או מאושרת על ידי TradingView. קרא עוד ב־תנאי השימוש.