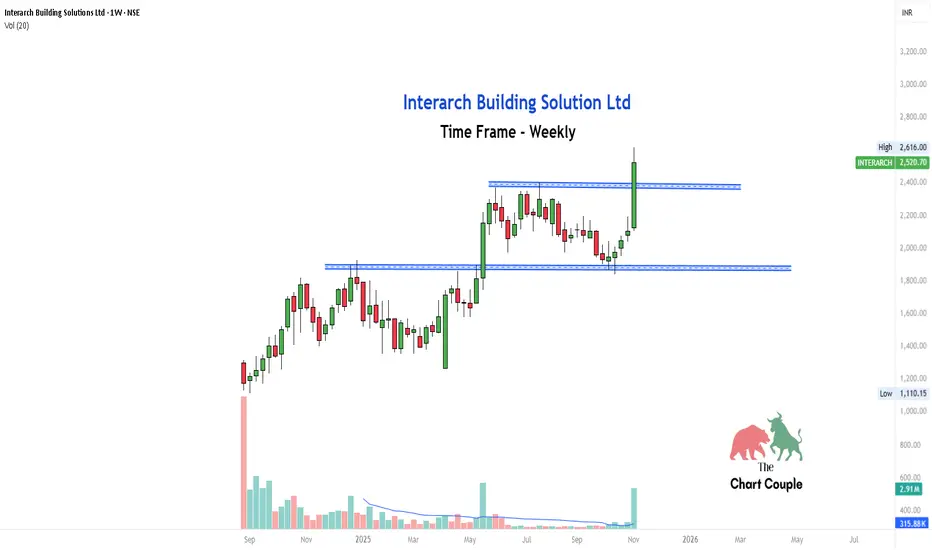
Interarch Building Solution Ltd recently broke above a well-defined resistance zone around ₹2,400 after consolidating for several weeks.
The breakout candle is supported by noticeable volume, which validates the move and makes it a strong case study for breakout learners.
What can we learn here:
Breakouts are more reliable on higher timeframes like weekly charts.
Volume expansion often precedes sustained momentum.
Patience during consolidation phases pays off when structure confirms breakout.
כתב ויתור
המידע והפרסומים אינם מיועדים להיות, ואינם מהווים, ייעוץ או המלצה פיננסית, השקעתית, מסחרית או מכל סוג אחר המסופקת או מאושרת על ידי TradingView. קרא עוד ב־תנאי השימוש.
כתב ויתור
המידע והפרסומים אינם מיועדים להיות, ואינם מהווים, ייעוץ או המלצה פיננסית, השקעתית, מסחרית או מכל סוג אחר המסופקת או מאושרת על ידי TradingView. קרא עוד ב־תנאי השימוש.