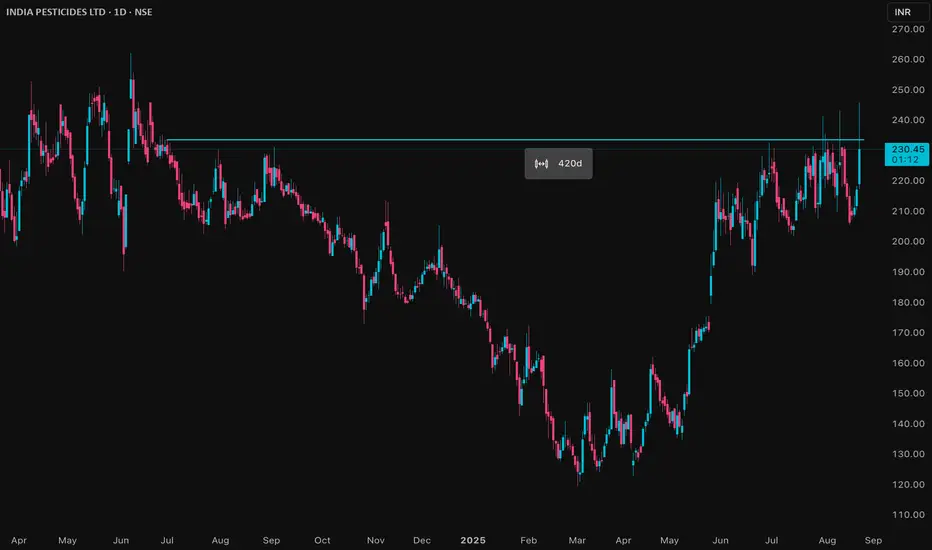
India Pesticides Ltd (IPL) is trading at ₹217.3 as of August 21, 2025. The stock has shown impressive strength recently, with a gain of 9% today and an intraday high of ₹238.5. It is just 3% below its 52-week high of ₹244.25, reflecting its robust upward momentum.
Over the last six months, IPL has surged by nearly 65% and is up 4% for the past year, outperforming major indices. The company's valuation stands at a PE ratio of 25 and a price-to-book (PB) ratio of 0.36, which is moderate for the agro-chem sector.
Operationally, IPL remains almost debt free and has recently expanded its manufacturing capacity, which could support further growth. The company’s return on capital employed (ROCE) is about 13%, with a return on equity (ROE) of around 9.5%. Key strengths include solid financials, improved sales, and sector-wide optimism.
Trading volumes are strong, and IPL is above all major moving averages, signaling bullish sentiment. Support is seen near ₹206–₹208, while resistance is close to ₹244 (recent high).
In summary, IPL continues to display strength, buoyed by expansion efforts and solid financial metrics. Momentum and technical indicators favor further upside if broader market conditions remain supportive.
כתב ויתור
המידע והפרסומים אינם אמורים להיות, ואינם מהווים, עצות פיננסיות, השקעות, מסחר או סוגים אחרים של עצות או המלצות שסופקו או מאושרים על ידי TradingView. קרא עוד בתנאים וההגבלות.
כתב ויתור
המידע והפרסומים אינם אמורים להיות, ואינם מהווים, עצות פיננסיות, השקעות, מסחר או סוגים אחרים של עצות או המלצות שסופקו או מאושרים על ידי TradingView. קרא עוד בתנאים וההגבלות.