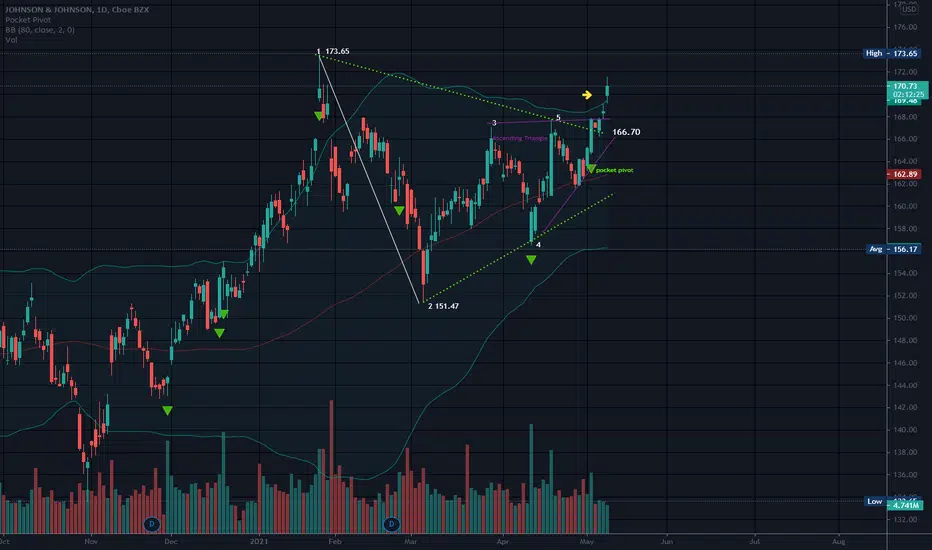
173.65 is the long term high.
JNJ has broken free of both triangles, as well as the bollinger bands.
Bollinger bands are set on this chart using an eighty day moving average verses the norm of 20. Price is above the top band today which is bullish, but it is likely that price will return to the inside of the bands.
No recommendation
כתב ויתור
המידע והפרסומים אינם אמורים להיות, ואינם מהווים, עצות פיננסיות, השקעות, מסחר או סוגים אחרים של עצות או המלצות שסופקו או מאושרים על ידי TradingView. קרא עוד בתנאים וההגבלות.
כתב ויתור
המידע והפרסומים אינם אמורים להיות, ואינם מהווים, עצות פיננסיות, השקעות, מסחר או סוגים אחרים של עצות או המלצות שסופקו או מאושרים על ידי TradingView. קרא עוד בתנאים וההגבלות.