לונג
NASDAQ Up!
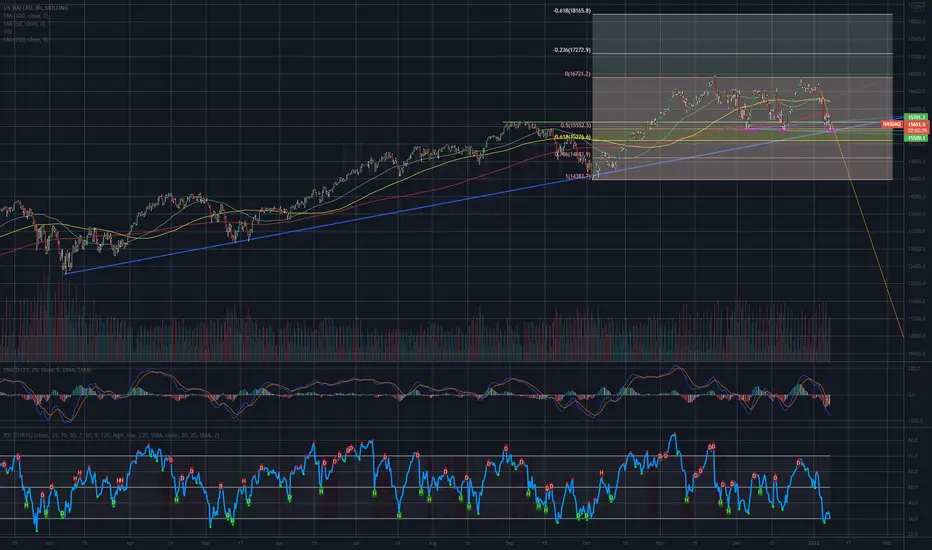
Nasdaq should grow from here.
- Triple Bottom (see purple drawings)
- Long term vertical support (blue line)
- Short term horizontal support (green line)
- TLT made a breakout downwards (usually inversely correlated with indices)
- Fibonacci 50% hit
- Bullish divergence on RSI (we had a lower low on the candle, but RSI was higher compared to lower candle before)
I reckon this will go up from here and we could potentially see a new ATH at ~18100 points.
However - we need to wait for confirmation (breakout above orange vertical resistance).
Good luck with your trading.
כתב ויתור
המידע והפרסומים אינם מיועדים להיות, ואינם מהווים, ייעוץ או המלצה פיננסית, השקעתית, מסחרית או מכל סוג אחר המסופקת או מאושרת על ידי TradingView. קרא עוד ב־תנאי השימוש.
כתב ויתור
המידע והפרסומים אינם מיועדים להיות, ואינם מהווים, ייעוץ או המלצה פיננסית, השקעתית, מסחרית או מכל סוג אחר המסופקת או מאושרת על ידי TradingView. קרא עוד ב־תנאי השימוש.