🧾 Chart Analysis Summary (Daily Timeframe)
Key Details Value
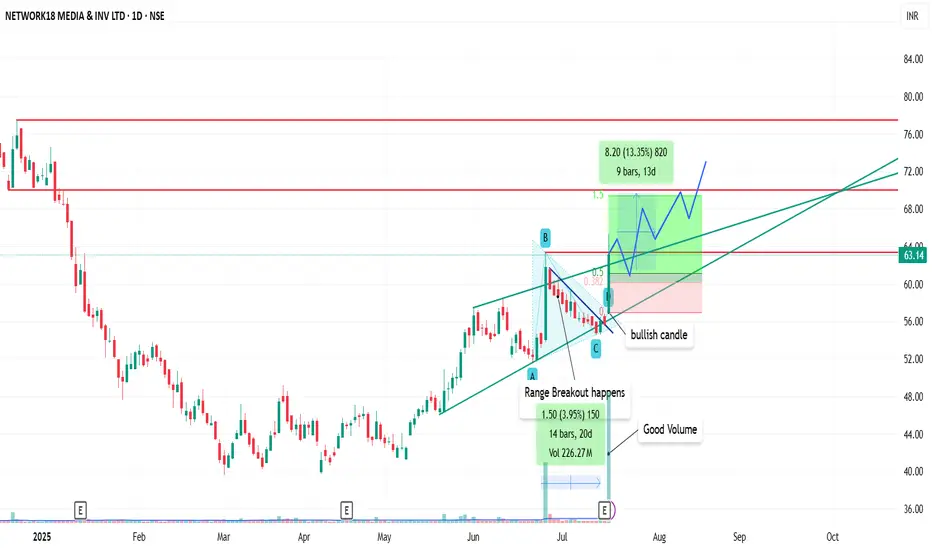
📈 CMP ₹63.14
🔺 Daily Gain +₹7.43 (+13.34%)
📊 Volume 318.44M (very strong volume)
🧱 Pattern ABC corrective structure + triangle breakout
📐 Setup Type Breakout + Pullback + Entry
🔍 Technical Analysis Insights
🟢 Bullish Structure
🔼 ABC Correction: Chart shows A-B-C correction forming a falling wedge/triangle.
✅ Breakout Confirmed: A strong bullish candle broke the range with high volume, confirming breakout.
🔄 Retest Entry Area: Entry zone is marked between ₹61–₹63 — current price is near the ideal buying zone.
🧱 Support Trendline: Strong diagonal support is visible; price is above it.
📦 Volume Spike
The huge green candle breakout has volume > 3x recent average, indicating strong buyer interest.
🎯 Trade Setup Parameters
Element Level / Note
🛒 Entry ₹61–₹63 (CMP is inside entry zone)
🛑 Stop Loss ₹58 (below breakout structure)
🎯 Target 1 (1.5x) ₹71–₹72 (around 13.35% up)
🧱 Target 2 ₹77–₹80 (next resistance zone)
⚖️ Risk:Reward 1:1.5+
💡 Observations
✅ Volume + Breakout + Retest = High Probability Trade.
⚠️ Monitor for consolidation between ₹64–₹67 before momentum resumes.
📌 Trail stop loss or partial booking advised near first target.
📝 Conclusion
This is a textbook breakout-retest-buy setup with:
Strong structure
Clear SL & target
Volume confirmation
Risk:Reward in favor
Key Details Value
📈 CMP ₹63.14
🔺 Daily Gain +₹7.43 (+13.34%)
📊 Volume 318.44M (very strong volume)
🧱 Pattern ABC corrective structure + triangle breakout
📐 Setup Type Breakout + Pullback + Entry
🔍 Technical Analysis Insights
🟢 Bullish Structure
🔼 ABC Correction: Chart shows A-B-C correction forming a falling wedge/triangle.
✅ Breakout Confirmed: A strong bullish candle broke the range with high volume, confirming breakout.
🔄 Retest Entry Area: Entry zone is marked between ₹61–₹63 — current price is near the ideal buying zone.
🧱 Support Trendline: Strong diagonal support is visible; price is above it.
📦 Volume Spike
The huge green candle breakout has volume > 3x recent average, indicating strong buyer interest.
🎯 Trade Setup Parameters
Element Level / Note
🛒 Entry ₹61–₹63 (CMP is inside entry zone)
🛑 Stop Loss ₹58 (below breakout structure)
🎯 Target 1 (1.5x) ₹71–₹72 (around 13.35% up)
🧱 Target 2 ₹77–₹80 (next resistance zone)
⚖️ Risk:Reward 1:1.5+
💡 Observations
✅ Volume + Breakout + Retest = High Probability Trade.
⚠️ Monitor for consolidation between ₹64–₹67 before momentum resumes.
📌 Trail stop loss or partial booking advised near first target.
📝 Conclusion
This is a textbook breakout-retest-buy setup with:
Strong structure
Clear SL & target
Volume confirmation
Risk:Reward in favor
פרסומים קשורים
כתב ויתור
המידע והפרסומים אינם אמורים להיות, ואינם מהווים, עצות פיננסיות, השקעות, מסחר או סוגים אחרים של עצות או המלצות שסופקו או מאושרים על ידי TradingView. קרא עוד בתנאים וההגבלות.
פרסומים קשורים
כתב ויתור
המידע והפרסומים אינם אמורים להיות, ואינם מהווים, עצות פיננסיות, השקעות, מסחר או סוגים אחרים של עצות או המלצות שסופקו או מאושרים על ידי TradingView. קרא עוד בתנאים וההגבלות.