Based on the charts and the market's performance on Thursday, October 16, the Nifty experienced a powerful breakout, crossing the major resistance zone and closing near the day's high. The structure is now firmly bullish and aiming for higher targets.
Detailed Market Structure Breakdown
4-Hour Chart (Macro Trend)
Structure: The Nifty is now in a strong momentum phase. The price has decisively broken out above the 25,300 - 25,400 major supply zone, confirming the continuation of the bullish recovery. The candle has broken out of the ascending channel and is trading at levels not seen since the high in September.
Key Levels:
Major Supply (Resistance): 25,650 - 25,750. This area is the next significant resistance zone, aligning with the extended trendline (as seen on the 4H chart) and previous swing highs.
Major Demand (Support): 25,300 - 25,400. This area, which was the critical resistance zone, is now the new must-hold demand zone for the bulls.
Outlook: The short-term bias is strongly bullish. The rally is aggressive and the next target is near the 25,700 level.
1-Hour Chart (Intermediate View)
Structure: The 1H chart shows an exceptionally strong day, with the price making higher highs and higher lows and closing near the top. The bullish conviction is very high. The recent correction on Oct 14 was efficiently bought up at the FVG.
Key Levels:
Immediate Resistance: 25,650 (Upper channel trendline).
Immediate Support: 25,480 - 25,500 (Recent consolidation support and lower channel trendline).
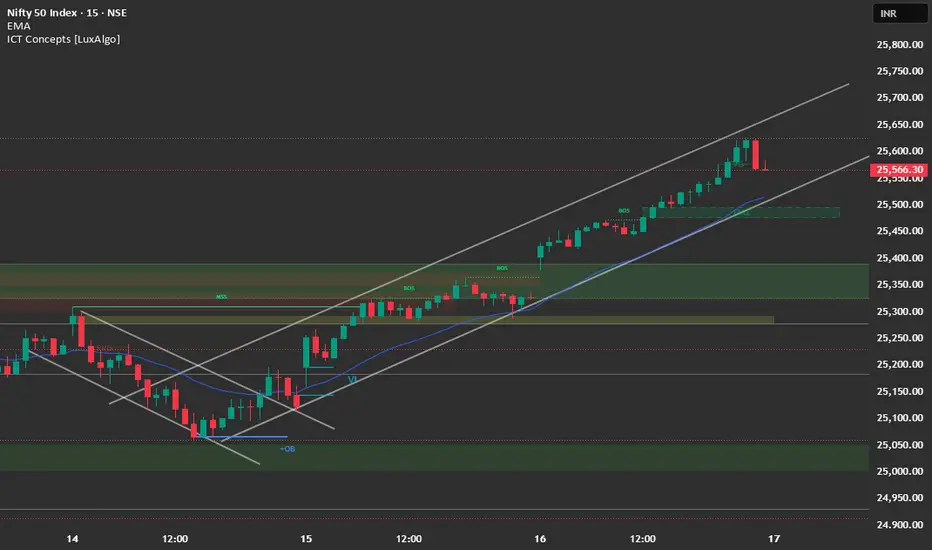
15-Minute Chart (Intraday View)
Structure: The 15M chart confirms the powerful bullish momentum. The market consolidated around 25,450 and then broke out aggressively, closing at the day's high. The structure is a clear uptrend continuation.
Key Levels:
Intraday Supply: 25,650.
Intraday Demand: 25,480 - 25,500.
Outlook: Aggressively Bullish.
📈 Trade Plan (Friday, 17th October)
Market Outlook: The Nifty is in a high-conviction bullish trend. The market is also digesting Q2 results from IT majors (Infosys, Wipro, LTIMindtree). The primary strategy will be to buy on dips for continuation.
Bullish Scenario (Primary Plan)
Justification: The strong breakout and close above 25,300 - 25,400 strongly favor continuation towards the next major resistance.
Entry: Long entry on a decisive break and 15-minute candle close above 25,650 (breaking the upper channel). Alternatively, look for a dip entry near 25,480 - 25,500 (the immediate support/FVG zone).
Stop Loss (SL): Place a stop loss below 25,400 (below the major breakout level).
Targets:
T1: 25,750 (Extension target).
T2: 25,850 (Major weekly resistance).
Bearish Scenario (Counter-Trend Plan)
Justification: Only valid if a sharp sell-off occurs, likely due to unexpected negative global news or disappointing market reaction to the full suite of IT earnings.
Trigger: A decisive break and 1-hour candle close below 25,300.
Entry: Short entry below 25,300.
Stop Loss (SL): Above 25,450.
Targets:
T1: 25,150 (Previous consolidation support).
T2: 25,000 (Psychological support).
Key Levels for Observation:
Immediate Decision Point: 25,500 - 25,650 zone.
Bullish Confirmation: A break and sustained move above 25,650.
Bearish Warning: A move below 25,450 suggests profit-booking is aggressive.
Line in the Sand: 25,300. Below this level, the short-term bullish momentum is lost.
Time Cluster: Friday, Oct 17 is projected as a key time cluster for heightened momentum.
Detailed Market Structure Breakdown
4-Hour Chart (Macro Trend)
Structure: The Nifty is now in a strong momentum phase. The price has decisively broken out above the 25,300 - 25,400 major supply zone, confirming the continuation of the bullish recovery. The candle has broken out of the ascending channel and is trading at levels not seen since the high in September.
Key Levels:
Major Supply (Resistance): 25,650 - 25,750. This area is the next significant resistance zone, aligning with the extended trendline (as seen on the 4H chart) and previous swing highs.
Major Demand (Support): 25,300 - 25,400. This area, which was the critical resistance zone, is now the new must-hold demand zone for the bulls.
Outlook: The short-term bias is strongly bullish. The rally is aggressive and the next target is near the 25,700 level.
1-Hour Chart (Intermediate View)
Structure: The 1H chart shows an exceptionally strong day, with the price making higher highs and higher lows and closing near the top. The bullish conviction is very high. The recent correction on Oct 14 was efficiently bought up at the FVG.
Key Levels:
Immediate Resistance: 25,650 (Upper channel trendline).
Immediate Support: 25,480 - 25,500 (Recent consolidation support and lower channel trendline).
15-Minute Chart (Intraday View)
Structure: The 15M chart confirms the powerful bullish momentum. The market consolidated around 25,450 and then broke out aggressively, closing at the day's high. The structure is a clear uptrend continuation.
Key Levels:
Intraday Supply: 25,650.
Intraday Demand: 25,480 - 25,500.
Outlook: Aggressively Bullish.
📈 Trade Plan (Friday, 17th October)
Market Outlook: The Nifty is in a high-conviction bullish trend. The market is also digesting Q2 results from IT majors (Infosys, Wipro, LTIMindtree). The primary strategy will be to buy on dips for continuation.
Bullish Scenario (Primary Plan)
Justification: The strong breakout and close above 25,300 - 25,400 strongly favor continuation towards the next major resistance.
Entry: Long entry on a decisive break and 15-minute candle close above 25,650 (breaking the upper channel). Alternatively, look for a dip entry near 25,480 - 25,500 (the immediate support/FVG zone).
Stop Loss (SL): Place a stop loss below 25,400 (below the major breakout level).
Targets:
T1: 25,750 (Extension target).
T2: 25,850 (Major weekly resistance).
Bearish Scenario (Counter-Trend Plan)
Justification: Only valid if a sharp sell-off occurs, likely due to unexpected negative global news or disappointing market reaction to the full suite of IT earnings.
Trigger: A decisive break and 1-hour candle close below 25,300.
Entry: Short entry below 25,300.
Stop Loss (SL): Above 25,450.
Targets:
T1: 25,150 (Previous consolidation support).
T2: 25,000 (Psychological support).
Key Levels for Observation:
Immediate Decision Point: 25,500 - 25,650 zone.
Bullish Confirmation: A break and sustained move above 25,650.
Bearish Warning: A move below 25,450 suggests profit-booking is aggressive.
Line in the Sand: 25,300. Below this level, the short-term bullish momentum is lost.
Time Cluster: Friday, Oct 17 is projected as a key time cluster for heightened momentum.
כתב ויתור
המידע והפרסומים אינם מיועדים להיות, ואינם מהווים, ייעוץ או המלצה פיננסית, השקעתית, מסחרית או מכל סוג אחר המסופקת או מאושרת על ידי TradingView. קרא עוד ב־תנאי השימוש.
כתב ויתור
המידע והפרסומים אינם מיועדים להיות, ואינם מהווים, ייעוץ או המלצה פיננסית, השקעתית, מסחרית או מכל סוג אחר המסופקת או מאושרת על ידי TradingView. קרא עוד ב־תנאי השימוש.