🔎 Market Structure Analysis
4H Chart (Swing Context)
Current Price Action: Nifty is trading within an ascending channel, currently encountering resistance within the 25,100–25,200 supply zone.
Previous Impulsive Leg: Price has broken above the 24,900 level, which was former resistance and is now acting as a demand zone.
Bias: Short-term bullish, but facing a significant resistance zone. There's potential for a pullback from this supply area before any further upward movement.
1H Chart (Intraday Context)
Structure: The chart shows a clear series of higher highs and higher lows, indicating a bullish market structure on the intraday timeframe.
Key Levels:The 24,900–25,000 area has acted as a strong demand zone with multiple rejections, reinforcing its significance.
Current Price Action: Price is consolidating just below the 25,100–25,200 red supply zone, showing indecision. A recent "BOS" (Break of Structure) above 25,000 confirmed buyer dominance in the immediate past.
Liquidity: While upside liquidity was targeted earlier (as indicated by "Buyside liquidity" annotation), the current consolidation suggests a pause before potentially seeking further liquidity above the 25,200 level.
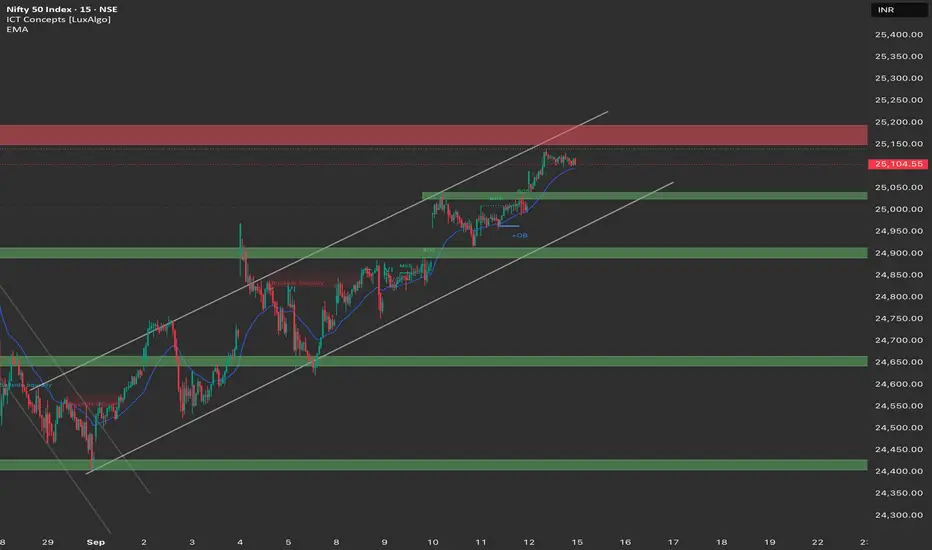
15m Chart (Execution View)
Price Action: Sideways consolidation is observed just below the 25,100–25,200 supply zone.
Order Block (OB): An order block around 24,900–24,950 is acting as a support level, potentially absorbing any immediate downside pressure. There's also a smaller OB labeled around 25,050.
Fair Value Gaps (FVGs): Small FVGs in the 25,050–25,100 zone may offer intraday support if price retraces.
Channel: Price is respecting the upper boundary of the ascending channel.
📝 Trade Plan (15th Sept)
Bullish Scenario
Entry: Buy on a retracement to the demand zone around 24,900–24,950 (acting as a significant OB + structure support). Alternatively, a buy could be considered on a decisive break and retest of the 25,100 level if it holds as support.
Targets:
TP1: 25,150 (previous high/immediate resistance)
TP2: 25,200–25,250 (supply zone top & channel resistance)
Stop Loss: Below 24,850 (below the significant OB and former structural support).
Bearish Scenario
Entry: Short only if price strongly rejects the 25,150–25,250 supply zone with a clear bearish engulfing candle or a significant break of the 1H structure (CHoCH).
Targets:
TP1: 25,050 (immediate FVG fill/minor support)
TP2: 24,950–24,900 (major demand zone)
Stop Loss: Above 25,250 (above the supply zone).
🎯 Bias
Neutral-to-Bullish. Expecting a potential pullback to the 24,900–24,950 demand zone before another attempt to break higher.
Caution: A failure to hold the 24,900–24,950 demand zone could lead to acceleration lower, targeting the lower support levels within the ascending channel or even the next significant demand zone below. The 25,100–25,200 zone is a critical area of resistance to watch closely.
4H Chart (Swing Context)
Current Price Action: Nifty is trading within an ascending channel, currently encountering resistance within the 25,100–25,200 supply zone.
Previous Impulsive Leg: Price has broken above the 24,900 level, which was former resistance and is now acting as a demand zone.
Bias: Short-term bullish, but facing a significant resistance zone. There's potential for a pullback from this supply area before any further upward movement.
1H Chart (Intraday Context)
Structure: The chart shows a clear series of higher highs and higher lows, indicating a bullish market structure on the intraday timeframe.
Key Levels:The 24,900–25,000 area has acted as a strong demand zone with multiple rejections, reinforcing its significance.
Current Price Action: Price is consolidating just below the 25,100–25,200 red supply zone, showing indecision. A recent "BOS" (Break of Structure) above 25,000 confirmed buyer dominance in the immediate past.
Liquidity: While upside liquidity was targeted earlier (as indicated by "Buyside liquidity" annotation), the current consolidation suggests a pause before potentially seeking further liquidity above the 25,200 level.
15m Chart (Execution View)
Price Action: Sideways consolidation is observed just below the 25,100–25,200 supply zone.
Order Block (OB): An order block around 24,900–24,950 is acting as a support level, potentially absorbing any immediate downside pressure. There's also a smaller OB labeled around 25,050.
Fair Value Gaps (FVGs): Small FVGs in the 25,050–25,100 zone may offer intraday support if price retraces.
Channel: Price is respecting the upper boundary of the ascending channel.
📝 Trade Plan (15th Sept)
Bullish Scenario
Entry: Buy on a retracement to the demand zone around 24,900–24,950 (acting as a significant OB + structure support). Alternatively, a buy could be considered on a decisive break and retest of the 25,100 level if it holds as support.
Targets:
TP1: 25,150 (previous high/immediate resistance)
TP2: 25,200–25,250 (supply zone top & channel resistance)
Stop Loss: Below 24,850 (below the significant OB and former structural support).
Bearish Scenario
Entry: Short only if price strongly rejects the 25,150–25,250 supply zone with a clear bearish engulfing candle or a significant break of the 1H structure (CHoCH).
Targets:
TP1: 25,050 (immediate FVG fill/minor support)
TP2: 24,950–24,900 (major demand zone)
Stop Loss: Above 25,250 (above the supply zone).
🎯 Bias
Neutral-to-Bullish. Expecting a potential pullback to the 24,900–24,950 demand zone before another attempt to break higher.
Caution: A failure to hold the 24,900–24,950 demand zone could lead to acceleration lower, targeting the lower support levels within the ascending channel or even the next significant demand zone below. The 25,100–25,200 zone is a critical area of resistance to watch closely.
כתב ויתור
המידע והפרסומים אינם מיועדים להיות, ואינם מהווים, ייעוץ או המלצה פיננסית, השקעתית, מסחרית או מכל סוג אחר המסופקת או מאושרת על ידי TradingView. קרא עוד ב־תנאי השימוש.
כתב ויתור
המידע והפרסומים אינם מיועדים להיות, ואינם מהווים, ייעוץ או המלצה פיננסית, השקעתית, מסחרית או מכל סוג אחר המסופקת או מאושרת על ידי TradingView. קרא עוד ב־תנאי השימוש.