Outlook: What to Watch on 29th Sep 2025
• The market is likely to open cautiously Last trading day before SEP Exp;
(Though GIFTNIFTY closed with Minor +Ve @ 24705 (+15 odd points.) compare to NIFTY FUT @ 24689.9, with limited directional conviction unless new catalysts emerge.
*** Made a Low near 78.6% (@ 24628.15) Fib Retracement level of recent Swing Low @24404.70 & Swing High @25448.95 Treated as Strong Correction So can say Pullback Rally can not be Ruled out.
• Support zones to watch: ~ 24,400 to ~ 24,520 (Watch Plotted and Tabled levels)
• Resistance / hurdle zones: ~ 24,800 to ~ 25,000 (Watch Plotted and Tabled levels)
• Expect volatility, as India VIX had spiked (~ +6 %) in the previous session, indicating heightened nervousness.
Technical Analysis: Patterns, Indicators, and Key Levels
Technical charts reveal a bearish undertone following recent declines. The index has logged multiple red sessions, with the latest close at 24,654.70 on September 26, 2024, marking a 0.95% drop. Candlestick patterns, including Doji formations, signal indecision amid profit booking in banking and IT sectors. Intraday indicators like RSI (hovering near neutral 45-55) suggest no extreme overbought/oversold conditions, but a break below 24,700 could accelerate selling. Support and resistance levels are critical
Level Type,Key Levels (INR),Implications
Support,"24,676-24,700, 24,400",Potential bounce zones; breach signals deeper correction.
Resistance,"24,761, 25,000-25,100","Upside caps; sustained break could target 25,200."
Fundamental Analysis: Macro Cues, Flows, and Sectoral Impacts
India's macroeconomic backdrop remains robust, with GDP growth projected above 7% for FY25, driven by domestic demand. Inflation has eased, bolstering hopes for RBI rate cuts (potentially 25 bps if benign trends persist). However, FII/DII flows tilt negative: Recent data shows FII selling amid US tariff fears on pharma and visa hikes impacting IT (e.g., 1-2% sectoral drops). DIIs have countered with buys, providing some cushion.
Sectoral news: IT and pharma face headwinds from US policies, while energy and metals benefit from stable global commodities. Global markets add pressure—US indices mixed, Asian peers down—potentially dragging Nifty via correlated moves. Assumptions: No major RBI announcements today; focus on flows as primary driver.
Balanced perspective: Strong inflows and export resilience could mitigate downsides, but short-term sentiment favors caution.
Sector Performance Impact, Key Drivers
IT Down 1-2%, "US visa curbs, tariffs"
Pharma Down 1%, Global trade tensions
Banking Mixed FII outflows offset by DII
Energy Stable Commodity prices
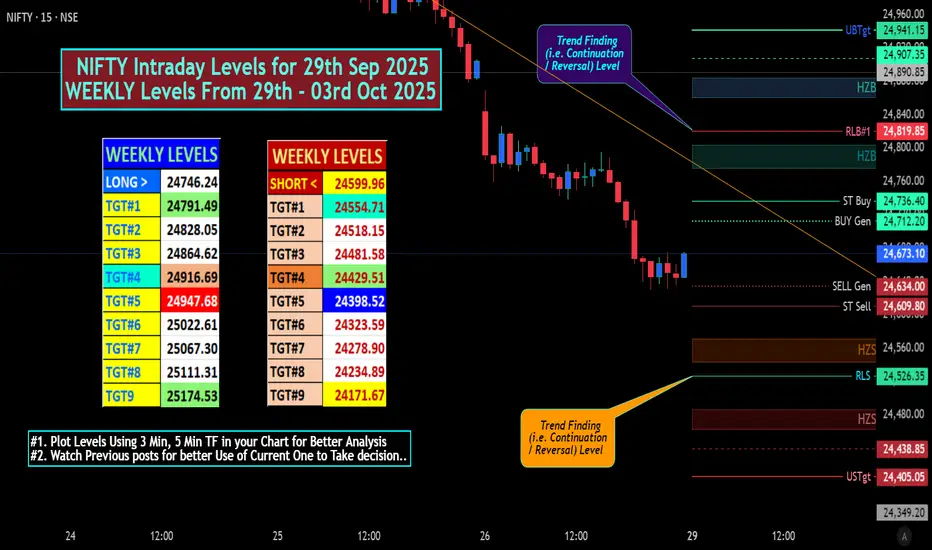
# "WEEKLY Levels" mentioned in BOX format.
^^^^^^^Plot Levels Using 3 Min, 5 Min Time frame in your Chart for Better Analysis^^^^^^^
L#1: If the candle crossed & stays above the “Buy Gen”, it is treated / considered as Bullish bias.
L#2: Possibility / Probability of REVERSAL near RLB#1 & UBTgt
L#3: If the candle stays above “Sell Gen” but below “Buy Gen”, it is treated / considered as Sidewise. Aggressive Traders can take Long position near “Sell Gen” either retesting or crossed from Below & vice-versa i.e. can take Short position near “Buy Gen” either retesting or crossed downward from Above.
L#4: If the candle crossed & stays below the “Sell Gen”, it is treated / considered a Bearish bias.
L#5: Possibility / Probability of REVERSAL near RLS#1 & USTgt
HZB (Buy side) & HZS (Sell side) => Hurdle Zone,
*** Specialty of “HZB#1, HZB#2 HZS#1 & HZS#2” is Sidewise (behaviour in Nature)
Rest Plotted and Mentioned on Chart
Color code Used:
Green =. Positive bias.
Red =. Negative bias.
RED in Between Green means Trend Finder / Momentum Change
/ CYCLE Change and Vice Versa.
Notice One thing: HOW LEVELS are Working.
Use any Momentum Indicator / Oscillatoror as you "USED to" to Take entry.
⚠️ DISCLAIMER:
The information, views, and ideas shared here are purely for educational and informational purposes only. They are not intended as investment advice or a recommendation to buy, sell, or hold any financial instruments. I am not a SEBI-registered financial adviser.
Trading and investing in the stock market involves risk, and you should do your own research and analysis. You are solely responsible for any decisions made based on this research.
"As HARD EARNED MONEY IS YOUR's, So DECISION SHOULD HAVE TO BE YOUR's".
Do comment if Helpful.
• The market is likely to open cautiously Last trading day before SEP Exp;
(Though GIFTNIFTY closed with Minor +Ve @ 24705 (+15 odd points.) compare to NIFTY FUT @ 24689.9, with limited directional conviction unless new catalysts emerge.
*** Made a Low near 78.6% (@ 24628.15) Fib Retracement level of recent Swing Low @24404.70 & Swing High @25448.95 Treated as Strong Correction So can say Pullback Rally can not be Ruled out.
• Support zones to watch: ~ 24,400 to ~ 24,520 (Watch Plotted and Tabled levels)
• Resistance / hurdle zones: ~ 24,800 to ~ 25,000 (Watch Plotted and Tabled levels)
• Expect volatility, as India VIX had spiked (~ +6 %) in the previous session, indicating heightened nervousness.
Technical Analysis: Patterns, Indicators, and Key Levels
Technical charts reveal a bearish undertone following recent declines. The index has logged multiple red sessions, with the latest close at 24,654.70 on September 26, 2024, marking a 0.95% drop. Candlestick patterns, including Doji formations, signal indecision amid profit booking in banking and IT sectors. Intraday indicators like RSI (hovering near neutral 45-55) suggest no extreme overbought/oversold conditions, but a break below 24,700 could accelerate selling. Support and resistance levels are critical
Level Type,Key Levels (INR),Implications
Support,"24,676-24,700, 24,400",Potential bounce zones; breach signals deeper correction.
Resistance,"24,761, 25,000-25,100","Upside caps; sustained break could target 25,200."
Fundamental Analysis: Macro Cues, Flows, and Sectoral Impacts
India's macroeconomic backdrop remains robust, with GDP growth projected above 7% for FY25, driven by domestic demand. Inflation has eased, bolstering hopes for RBI rate cuts (potentially 25 bps if benign trends persist). However, FII/DII flows tilt negative: Recent data shows FII selling amid US tariff fears on pharma and visa hikes impacting IT (e.g., 1-2% sectoral drops). DIIs have countered with buys, providing some cushion.
Sectoral news: IT and pharma face headwinds from US policies, while energy and metals benefit from stable global commodities. Global markets add pressure—US indices mixed, Asian peers down—potentially dragging Nifty via correlated moves. Assumptions: No major RBI announcements today; focus on flows as primary driver.
Balanced perspective: Strong inflows and export resilience could mitigate downsides, but short-term sentiment favors caution.
Sector Performance Impact, Key Drivers
IT Down 1-2%, "US visa curbs, tariffs"
Pharma Down 1%, Global trade tensions
Banking Mixed FII outflows offset by DII
Energy Stable Commodity prices
# "WEEKLY Levels" mentioned in BOX format.
^^^^^^^Plot Levels Using 3 Min, 5 Min Time frame in your Chart for Better Analysis^^^^^^^
L#1: If the candle crossed & stays above the “Buy Gen”, it is treated / considered as Bullish bias.
L#2: Possibility / Probability of REVERSAL near RLB#1 & UBTgt
L#3: If the candle stays above “Sell Gen” but below “Buy Gen”, it is treated / considered as Sidewise. Aggressive Traders can take Long position near “Sell Gen” either retesting or crossed from Below & vice-versa i.e. can take Short position near “Buy Gen” either retesting or crossed downward from Above.
L#4: If the candle crossed & stays below the “Sell Gen”, it is treated / considered a Bearish bias.
L#5: Possibility / Probability of REVERSAL near RLS#1 & USTgt
HZB (Buy side) & HZS (Sell side) => Hurdle Zone,
*** Specialty of “HZB#1, HZB#2 HZS#1 & HZS#2” is Sidewise (behaviour in Nature)
Rest Plotted and Mentioned on Chart
Color code Used:
Green =. Positive bias.
Red =. Negative bias.
RED in Between Green means Trend Finder / Momentum Change
/ CYCLE Change and Vice Versa.
Notice One thing: HOW LEVELS are Working.
Use any Momentum Indicator / Oscillatoror as you "USED to" to Take entry.
⚠️ DISCLAIMER:
The information, views, and ideas shared here are purely for educational and informational purposes only. They are not intended as investment advice or a recommendation to buy, sell, or hold any financial instruments. I am not a SEBI-registered financial adviser.
Trading and investing in the stock market involves risk, and you should do your own research and analysis. You are solely responsible for any decisions made based on this research.
"As HARD EARNED MONEY IS YOUR's, So DECISION SHOULD HAVE TO BE YOUR's".
Do comment if Helpful.
הערה
Intraday Probability EstimatesUpside (closes >24670): 55% – Based on oversold RSI, positive global peers, and DII inflows; assumes pullback from 24500 support.
Downside (closes <24670): 30% – Driven by FII selling, bearish candlestick patterns, and resistance at 24700; flat global Asia cues add weight.
Volatile Market (sharp up/down swings >1%): 25% – VIX uptick and OI buildup in options signal potential volatility; high if unexpected news hits.
הערה
TrendCurrent short-term price action shows recovery from intraday lows around 24,610–24,620.
Price broke above the earlier down-sloping trendline (orange) and is now consolidating just above the breakout.
Near-term structure = neutral to bullish intraday (as long as it holds above 24,700).
📉 Support Levels
24,712 – 24,716 → Immediate intraday support (BUY Gen line).
24,654 – 24,660 → Secondary support.
24,634 (SELL Gen) → Critical intraday pivot; below this, momentum turns bearish.
24,609 – 24,600 (ST Sell zone) → Strong support; if broken, downside opens sharply.
📈 Resistance Levels
24,736 – 24,740 (ST Buy line) → Immediate resistance, now being tested.
24,780 – 24,790 (HZB#1) → Major supply zone; sellers may defend this level.
24,820 (RLB#1) → Strong resistance; breakout above this can trigger momentum.
🎯 Targets
Upside (if above 24,740 and sustained):
Target 1: 24,780 (HZB zone)
Target 2: 24,820 (RLB#1)
Target 3 (extension): 24,860+ if momentum builds
Downside (if breaks 24,712 then 24,634):
Target 1: 24,654
Target 2: 24,609–24,600 (ST Sell zone)
Target 3 (extension): 24,560 if heavy selling
⚡ Trading Bias
Above 24,740 → Intraday bullish, buy dips toward 24,712 with stop below 24,680.
Below 24,634 → Intraday bearish, sell rallies toward 24,654 with target 24,600.
Between 24,712 – 24,740 → Neutral, expect rangebound chop.
פרסומים קשורים
כתב ויתור
המידע והפרסומים אינם אמורים להיות, ואינם מהווים, עצות פיננסיות, השקעות, מסחר או סוגים אחרים של עצות או המלצות שסופקו או מאושרים על ידי TradingView. קרא עוד בתנאים וההגבלות.
פרסומים קשורים
כתב ויתור
המידע והפרסומים אינם אמורים להיות, ואינם מהווים, עצות פיננסיות, השקעות, מסחר או סוגים אחרים של עצות או המלצות שסופקו או מאושרים על ידי TradingView. קרא עוד בתנאים וההגבלות.