🔎 Market Recap:
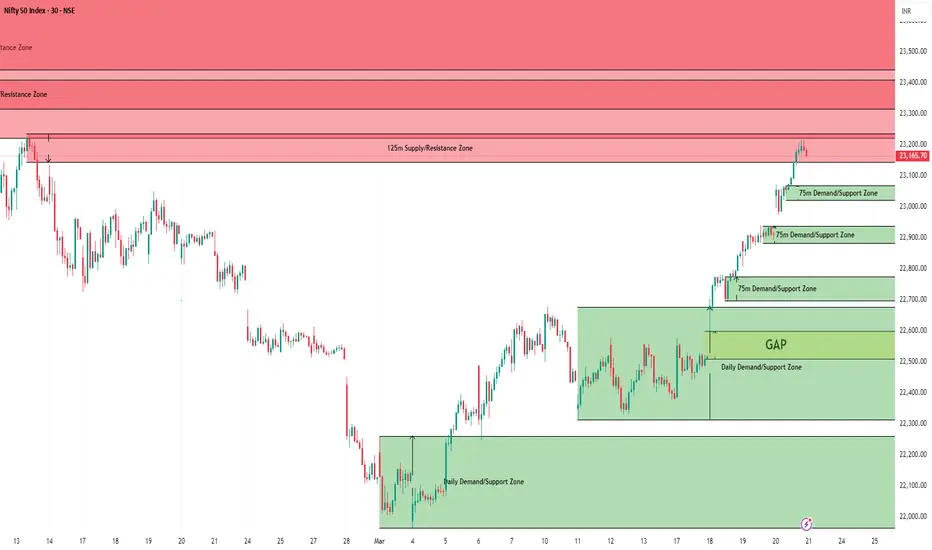
On Thursday, Nifty opened gap-up, dipped to a low of 22,973.95, and surged to a high of 23,216.70, entering the 125m Supply Zone (23,144.05 - 23,235.50). It closed strong at 23,190.65, gaining 283 points from the previous close.
📉 Trend Analysis:
Weekly Trend (50 SMA): Negative
Daily Trend (50 SMA): Sideways
📉 Demand/Support Zones:
Near Demand/Support Zone (75m): 23,021.60 - 23,068.25
Far Demand/Support Zone (75m): 22,882.80 - 22,937.70
Far Demand/Support Zone (75m): 22,697.75 - 22,774.35
Far Demand/Support Zone (Daily): 22,314.70 - 22,676.75
Far Demand/Support Zone (Daily): 21,964.60 - 22,261.55
Far Support: 21,281.45 (Low of 4th June 2024)
Far Demand/Support Zone (Daily): 20,769.50 - 20,950.00
📈 Supply/Resistance Zones:
Near Supply/Resistance Zone (125m): 23,144.05 - 23,235.50 (Tested)
Near Supply/Resistance Zone (Weekly): 23,222 - 23,807.30
Far Supply/Resistance Zone (125m): 23,316.30 - 23,409.65 (Inside Weekly Supply)
Far Supply/Resistance Zone (Daily): 23,443.20 - 23,807.30 (Inside Weekly Supply)
Far Supply/Resistance Zone (Daily): 23,976 - 24,196.45
Far Supply/Resistance Zone (Daily): 24,601.75 - 24,781.25
📊 Outlook & Strategy:
Nifty continued its bullish momentum, respecting lower demand zones and pushing higher into the 125m Supply Zone.
🔹 Short-term Trend: Bullish but overbought
🔹 Key Watch: If Nifty sustains above 23,144, we could see an extension towards 23,443 - 23,807 in the coming sessions. However, profit booking is possible from these supply zones.
🔹 Caution: 23,222 - 23,807 (Weekly Supply Zone) could act as a strong resistance, leading to a pullback towards 23,021 - 22,882 if rejection is observed.
📢 Disclaimer:
This analysis is for educational and informational purposes only and should not be considered as financial advice. Trading and investing in the stock market involve risk, and past performance does not guarantee future results. Always conduct your own research and consult with a certified financial advisor before making any trading decisions. The author is not responsible for any financial losses incurred based on this analysis.
פרסומים קשורים
כתב ויתור
המידע והפרסומים אינם אמורים להיות, ואינם מהווים, עצות פיננסיות, השקעות, מסחר או סוגים אחרים של עצות או המלצות שסופקו או מאושרים על ידי TradingView. קרא עוד בתנאים וההגבלות.
כתב ויתור
המידע והפרסומים אינם אמורים להיות, ואינם מהווים, עצות פיננסיות, השקעות, מסחר או סוגים אחרים של עצות או המלצות שסופקו או מאושרים על ידי TradingView. קרא עוד בתנאים וההגבלות.