Ticker: NVDA
Category: Market Structure / Elliott Wave Analysis
Author’s note: Educational analysis — not financial advice.
🧠 Market Context
NVIDIA has been one of the strongest growth stories in the last market cycle. However, after such a powerful move, many traders are now asking: Where are we in the broader structure — and what could come next?
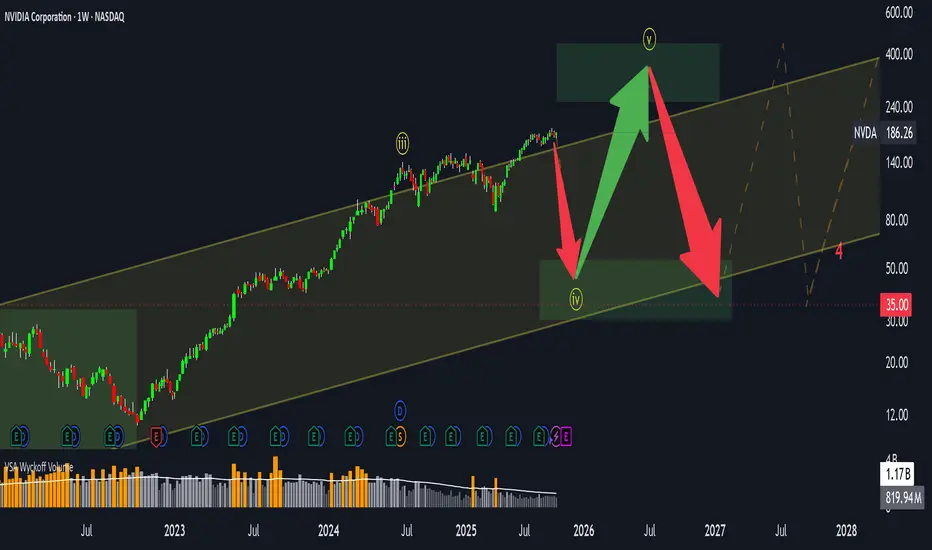
From a structural perspective, NVDA appears to have completed its third Elliott Wave, with the fourth wave currently in progress. This phase often reflects a period of consolidation, where the market digests previous gains before potentially starting the fifth wave.
📊 Elliott Wave Structure

Through the lens of Elliott Wave theory:
However, once the fifth wave completes, markets typically enter a longer consolidation or corrective phase — often retracing 50–60% of the total move from the highs.
⚙️ Volatility and Price Range
Currently, NVDA is trading within a broad channel, roughly between $100 and $400+.
Volatility remains elevated — which suggests that the sideways phase could persist for several months, or even longer.
Such behavior is common in late-cycle stages when large market participants distribute part of their holdings while retail interest remains high.
📈 Key Takeaways
In short, this might not be the best time to chase — but rather to observe how price behaves within the current channel.
💬 Final Thoughts

This analysis is purely educational and reflects one possible scenario based on market structure.
No one can predict the exact timing or depth of the next move — the market always decides.
👉 What do you think?
Are we already in the correction phase, or is there still one more leg up left for NVDA?
Share your view in the comments below 👇
Category: Market Structure / Elliott Wave Analysis
Author’s note: Educational analysis — not financial advice.
🧠 Market Context
NVIDIA has been one of the strongest growth stories in the last market cycle. However, after such a powerful move, many traders are now asking: Where are we in the broader structure — and what could come next?
From a structural perspective, NVDA appears to have completed its third Elliott Wave, with the fourth wave currently in progress. This phase often reflects a period of consolidation, where the market digests previous gains before potentially starting the fifth wave.
📊 Elliott Wave Structure
Through the lens of Elliott Wave theory:
- Wave 3 — likely completed after the parabolic advance that marked NVIDIA’s latest all-time highs.
- Wave 4 — a corrective phase, potentially forming a sideways or slightly downward structure.
- Wave 5 (ahead?) — may still occur, possibly extending above the upper boundary of the current price channel.
However, once the fifth wave completes, markets typically enter a longer consolidation or corrective phase — often retracing 50–60% of the total move from the highs.
⚙️ Volatility and Price Range
Currently, NVDA is trading within a broad channel, roughly between $100 and $400+.
Volatility remains elevated — which suggests that the sideways phase could persist for several months, or even longer.
Such behavior is common in late-cycle stages when large market participants distribute part of their holdings while retail interest remains high.
📈 Key Takeaways
- The main impulsive move seems to have already played out.
- The market may enter a range-bound or sideways phase, with local rallies still possible.
- Correction risks are gradually increasing, especially if the fifth wave develops and fails to sustain new highs.
In short, this might not be the best time to chase — but rather to observe how price behaves within the current channel.
💬 Final Thoughts
This analysis is purely educational and reflects one possible scenario based on market structure.
No one can predict the exact timing or depth of the next move — the market always decides.
👉 What do you think?
Are we already in the correction phase, or is there still one more leg up left for NVDA?
Share your view in the comments below 👇
עסקה פעילה
Since my October analysis, the larger structure has continued to unfold as expected. The recent small move above the previous high looks more like a Running Flat formation rather than the start of a new impulsive leg. In this structure we already have Wave A and Wave B, and the market is now preparing for the final Wave C.Wave C can either reach the previous low or move slightly below it. The main support level to watch is 86.50. Price may reach this area or come close to it before forming a reversal. A deeper break is also possible but still fits the corrective pattern as long as the market stays above 35. A move below 35 would invalidate the entire wave count.
My main expectation remains a corrective move into the 86.50 region, followed by a strong bounce. After this correction completes, NVIDIA should be ready for a new upward leg and a break above the previous high, with targets in the 250 plus area.
This update fully supports the broader idea from October and keeps the long term outlook unchanged.
FREE Trading Hub
👉 sdk-trading.com/discord
Real-time entries, exits and Q&A. Clean mid–term & long–term analysis. Free to join.
More analysis / forecasts:
sdk-trading.com
👉 sdk-trading.com/discord
Real-time entries, exits and Q&A. Clean mid–term & long–term analysis. Free to join.
More analysis / forecasts:
sdk-trading.com
פרסומים קשורים
כתב ויתור
המידע והפרסומים אינם מיועדים להיות, ואינם מהווים, ייעוץ או המלצה פיננסית, השקעתית, מסחרית או מכל סוג אחר המסופקת או מאושרת על ידי TradingView. קרא עוד ב־תנאי השימוש.