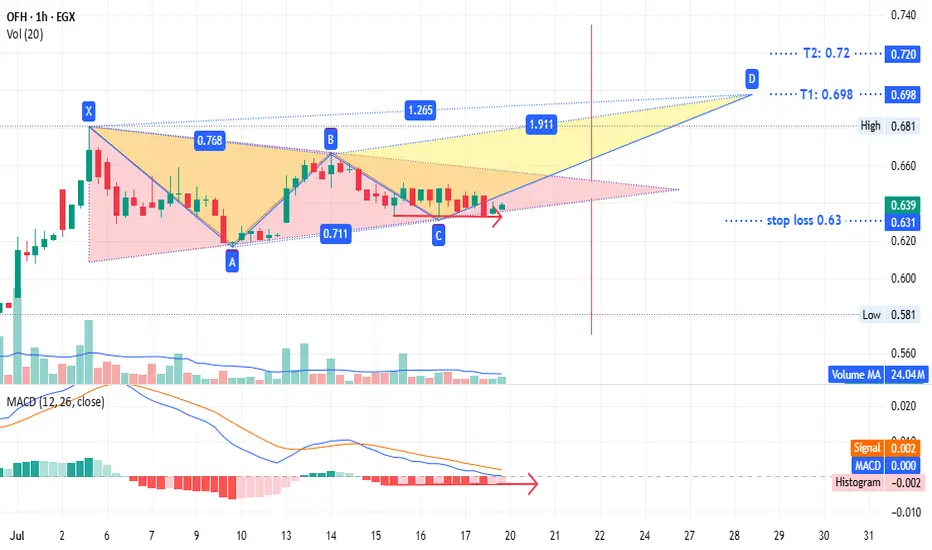
showing a potential triangle pattern with targets at
0.72 if prices close above the upper line or
0.57 if they close below the lower line.
Alternatively, a bearish pattern could target 0.698 to 0.72.
The stop loss is set at 0.63 to 0.624 (the gap from July 13) based on your strategy.
A long position here offers low risk (2% loss vs. ~10% profit potential).
This is not investment advice—only my chart analysis. Consult your account manager before investing. Good luck.
הערה
The triangle pattern is confirmed; the target is now 0.72 for a new high. Good luck.עסקה פעילה
amazing all targets achieved
last target at 0.735
if prices closed over 0.745 rebuy what you sell
good luck
עסקה סגורה: היעד הושג
all targets achieved for all patterns now we have a bearish pattern sell around 0.72
rebuy if prices closed over 0.745
T1: 0.695
T2: 0.665
This is not investment advice—only my chart analysis. Consult your account manager before investing. Good luck.
כתב ויתור
המידע והפרסומים אינם אמורים להיות, ואינם מהווים, עצות פיננסיות, השקעות, מסחר או סוגים אחרים של עצות או המלצות שסופקו או מאושרים על ידי TradingView. קרא עוד בתנאים וההגבלות.
כתב ויתור
המידע והפרסומים אינם אמורים להיות, ואינם מהווים, עצות פיננסיות, השקעות, מסחר או סוגים אחרים של עצות או המלצות שסופקו או מאושרים על ידי TradingView. קרא עוד בתנאים וההגבלות.