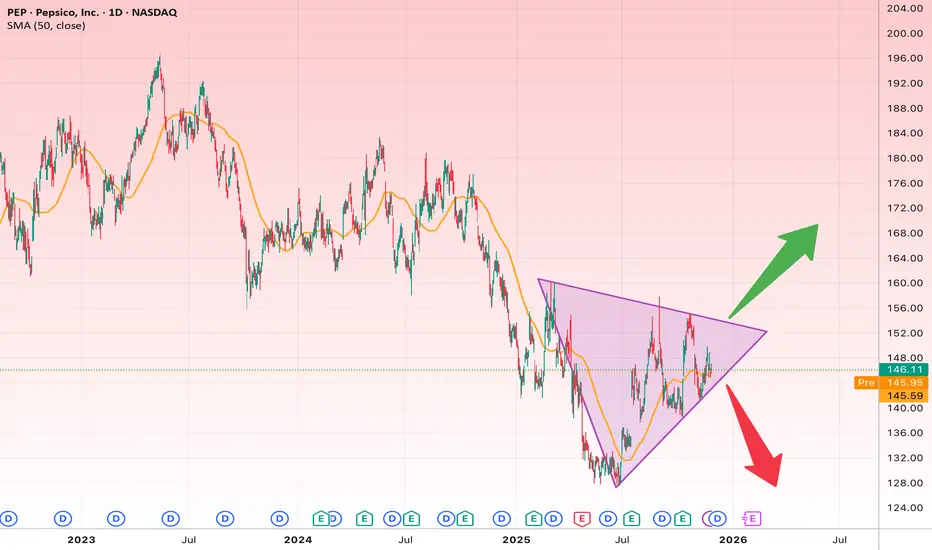
The PEP daily chart is forming a symmetrical triangle, a classic consolidation pattern that often leads to a strong breakout. Price has been bouncing between the upper and lower trendlines and is now positioned around the middle of the structure.
Bullish Scenario
If the price breaks above the upper trendline around $150–$152, a bullish continuation is likely.
Bullish Targets:
• Target 1: $160
• Target 2: $168
• Target 3: Up to $175 if momentum is strong
Bearish Scenario
Breaking below the lower triangle boundary (~$142) could trigger a deeper decline.
Bearish Targets:
• Target 1: $136
• Target 2: $130
Stop Loss
• For long positions: Below $142
• For short positions: Above $152
כתב ויתור
המידע והפרסומים אינם מיועדים להיות, ואינם מהווים, ייעוץ או המלצה פיננסית, השקעתית, מסחרית או מכל סוג אחר המסופקת או מאושרת על ידי TradingView. קרא עוד ב־תנאי השימוש.
כתב ויתור
המידע והפרסומים אינם מיועדים להיות, ואינם מהווים, ייעוץ או המלצה פיננסית, השקעתית, מסחרית או מכל סוג אחר המסופקת או מאושרת על ידי TradingView. קרא עוד ב־תנאי השימוש.