Intraday Technical Outlook (15m Chart)
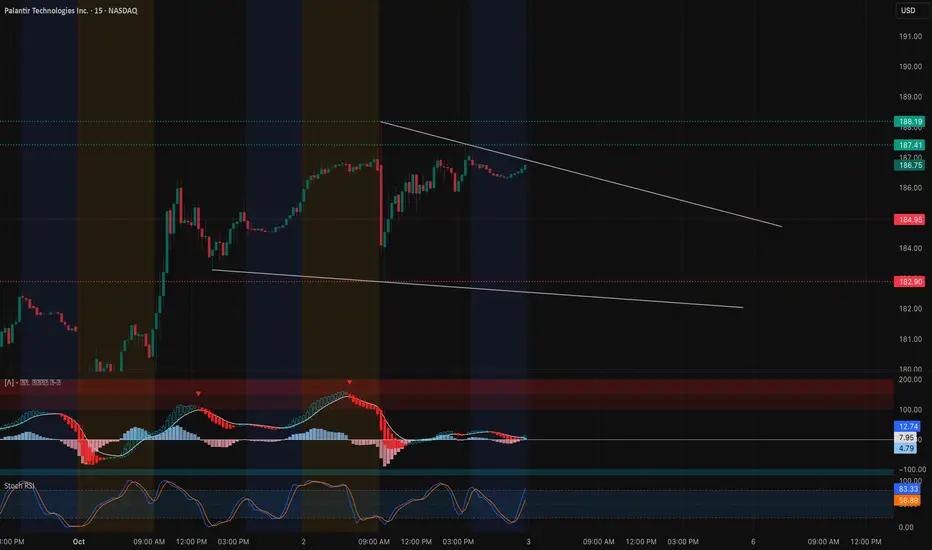
Palantir (PLTR) closed at $186.75, consolidating under a descending trendline after a strong run earlier this week. On the 15-minute chart, price is tightening into a wedge formation:
* MACD: Flattening near neutral after recent downside momentum, showing signs of a potential shift.
* Stoch RSI: Just bounced from mid-zone toward overbought, suggesting near-term strength if momentum holds.
* Key Levels: Resistance sits at $187.4–188.2, followed by $189.4. Support is at $185, with deeper downside near $183–182.9.
Intraday takeaway: PLTR needs to break above $188.2 for a clean breakout; otherwise, the wedge could force a pullback to $185.
Options Sentiment & GEX Outlook (1H Chart)

The GEX map highlights where institutional positioning could steer price action:
* Gamma Walls:
* $188–192.5: Heavy call wall cluster and highest positive GEX — major resistance zone.
* $185–182.5: Key support layers where dealer hedging may slow selling.
* $175 / $170: Large put walls that would act as magnets if downside momentum accelerates.
* Implications:
* Sustaining above $186.5–187 keeps price pinned toward the $188–190 gamma resistance zone.
* A rejection below $185 increases the risk of a pullback toward $182.5–180 before buyers reload.
* Volatility Context: IVR at 26 vs IVx avg 59.2 means premiums are slightly underpriced. With GEX tightly packed, directional breakouts could deliver outsized option moves.
My Thoughts & Recommendation
For Oct 3 trading, PLTR is sitting right at the breakout test:
* Intraday (scalping/trading): Bullish above $187.4 with targets at $188.2–189.5. Failure to break $188 risks fading back toward $185–183.
* Options trading (swing/0DTE): Calls make sense on confirmed breakout above $188, chasing toward $190–192. Puts become favorable if PLTR rejects $188 and slips back under $185, with $182.5 as the first magnet.
Bias heading into Oct 3: Bullish leaning, but only if $188 breaks cleanly.
Disclaimer: This analysis is for educational purposes only and does not constitute financial advice. Always do your own research and manage risk before trading.
Palantir (PLTR) closed at $186.75, consolidating under a descending trendline after a strong run earlier this week. On the 15-minute chart, price is tightening into a wedge formation:
* MACD: Flattening near neutral after recent downside momentum, showing signs of a potential shift.
* Stoch RSI: Just bounced from mid-zone toward overbought, suggesting near-term strength if momentum holds.
* Key Levels: Resistance sits at $187.4–188.2, followed by $189.4. Support is at $185, with deeper downside near $183–182.9.
Intraday takeaway: PLTR needs to break above $188.2 for a clean breakout; otherwise, the wedge could force a pullback to $185.
Options Sentiment & GEX Outlook (1H Chart)
The GEX map highlights where institutional positioning could steer price action:
* Gamma Walls:
* $188–192.5: Heavy call wall cluster and highest positive GEX — major resistance zone.
* $185–182.5: Key support layers where dealer hedging may slow selling.
* $175 / $170: Large put walls that would act as magnets if downside momentum accelerates.
* Implications:
* Sustaining above $186.5–187 keeps price pinned toward the $188–190 gamma resistance zone.
* A rejection below $185 increases the risk of a pullback toward $182.5–180 before buyers reload.
* Volatility Context: IVR at 26 vs IVx avg 59.2 means premiums are slightly underpriced. With GEX tightly packed, directional breakouts could deliver outsized option moves.
My Thoughts & Recommendation
For Oct 3 trading, PLTR is sitting right at the breakout test:
* Intraday (scalping/trading): Bullish above $187.4 with targets at $188.2–189.5. Failure to break $188 risks fading back toward $185–183.
* Options trading (swing/0DTE): Calls make sense on confirmed breakout above $188, chasing toward $190–192. Puts become favorable if PLTR rejects $188 and slips back under $185, with $182.5 as the first magnet.
Bias heading into Oct 3: Bullish leaning, but only if $188 breaks cleanly.
Disclaimer: This analysis is for educational purposes only and does not constitute financial advice. Always do your own research and manage risk before trading.
כתב ויתור
המידע והפרסומים אינם אמורים להיות, ואינם מהווים, עצות פיננסיות, השקעות, מסחר או סוגים אחרים של עצות או המלצות שסופקו או מאושרים על ידי TradingView. קרא עוד בתנאים וההגבלות.
כתב ויתור
המידע והפרסומים אינם אמורים להיות, ואינם מהווים, עצות פיננסיות, השקעות, מסחר או סוגים אחרים של עצות או המלצות שסופקו או מאושרים על ידי TradingView. קרא עוד בתנאים וההגבלות.