🔍 PNB
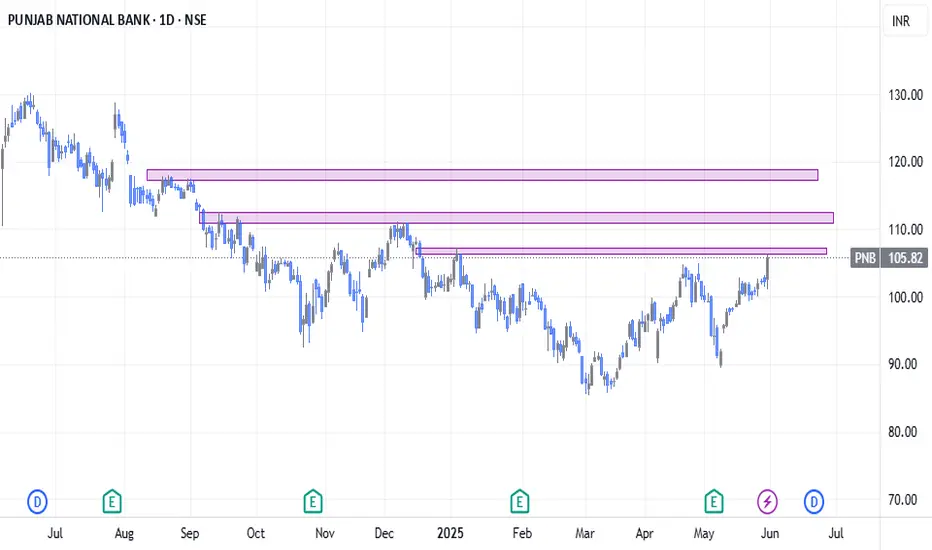
✅ Daily Chart:
PNB took support at the 200-day MA, forming a strong bullish candle — clear sign of buyer strength at a key level.
✅ Weekly Chart:
The stock closed above the 50-week MA, indicating momentum building on a higher timeframe.
🧱 Resistance Zone Ahead – ₹107.20 to ₹112:
Price is nearing a supply zone. Sustaining above ₹107.40 with volume would indicate strength and continuation.
📌 What to Watch:
🔼 Buy Trigger:
Only consider a potential move if price sustains above ₹107.40 with strong momentum and volume confirmation.
💡 Conclusion:
PNB is showing strength with a bullish structure — holding 200 MA on daily and crossing 50 MA on weekly. Focus remains on price action near ₹107.40 for further movement.
📊 Refer to the zones marked in the above chart for better clarity.
⚠️ Disclaimer: This is purely for educational purposes. Not financial advice. Please consult your advisor before making any trading decisions.
עסקה סגורה: היעד הושג
כתב ויתור
המידע והפרסומים אינם אמורים להיות, ואינם מהווים, עצות פיננסיות, השקעות, מסחר או סוגים אחרים של עצות או המלצות שסופקו או מאושרים על ידי TradingView. קרא עוד בתנאים וההגבלות.
כתב ויתור
המידע והפרסומים אינם אמורים להיות, ואינם מהווים, עצות פיננסיות, השקעות, מסחר או סוגים אחרים של עצות או המלצות שסופקו או מאושרים על ידי TradingView. קרא עוד בתנאים וההגבלות.