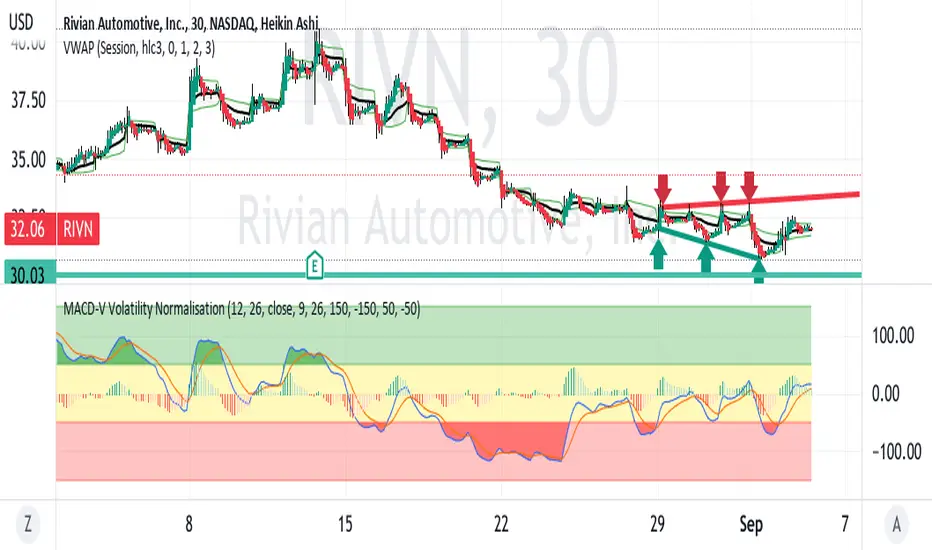
RIVN is in a slow down trending pattern right now within a megaphone
reflecting increasing volatility. The MACD shows the downward momentum
with more of the histogram negative below the zero level.
At present, the K / D lines are crossing over and above the histogram.
characteristic of a reversal to the downside.
Based on pivots in June and July, the horizontal support is at ~ $30.
Accordingly, a target on a short trade setup is just before $30.
This appears to be a good short trade setup where Rivian is
following the downtrend of the sector leader TSLA.
כתב ויתור
המידע והפרסומים אינם מיועדים להיות, ואינם מהווים, ייעוץ או המלצה פיננסית, השקעתית, מסחרית או מכל סוג אחר המסופקת או מאושרת על ידי TradingView. קרא עוד ב־תנאי השימוש.
כתב ויתור
המידע והפרסומים אינם מיועדים להיות, ואינם מהווים, ייעוץ או המלצה פיננסית, השקעתית, מסחרית או מכל סוג אחר המסופקת או מאושרת על ידי TradingView. קרא עוד ב־תנאי השימוש.