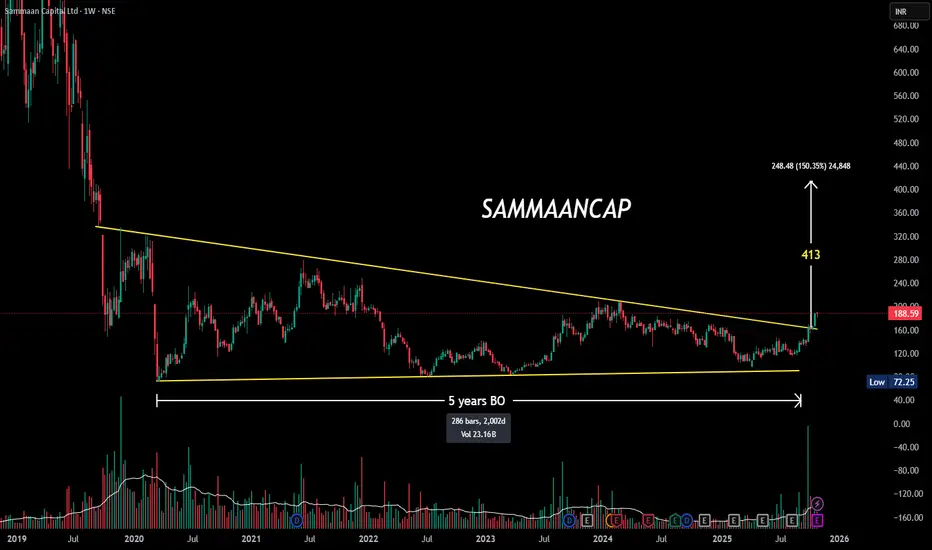
📈 #SAMMAANCAP | #TechnicalAnalysis
💥 5-Year Symmetrical Triangle Breakout at ₹165!
After a long consolidation, price breaks out with rising volume — a strong sign of trend reversal despite current negative earnings.
🔹 Pattern: Symmetrical Triangle
🔹 Breakout Zone: ₹165
🔹 CMP: ₹188
🔹 P/E: -5.9 (Loss-making)
🔹 P/BV: 0.7
🔹 Sector: Finance
⚙️ Sustaining above ₹165 could open room toward ₹220–₹240 over the medium term.
#PriceAction #BreakoutStocks #TradingView #ChartPatterns #SwingTrading #StockMarketIndia #TechnicalAnalysis #VolumeBreakout
כתב ויתור
המידע והפרסומים אינם מיועדים להיות, ואינם מהווים, ייעוץ או המלצה פיננסית, השקעתית, מסחרית או מכל סוג אחר המסופקת או מאושרת על ידי TradingView. קרא עוד ב־תנאי השימוש.
כתב ויתור
המידע והפרסומים אינם מיועדים להיות, ואינם מהווים, ייעוץ או המלצה פיננסית, השקעתית, מסחרית או מכל סוג אחר המסופקת או מאושרת על ידי TradingView. קרא עוד ב־תנאי השימוש.