Tube Investments of India Ltd (TIINDIA) has been a notable player in the Indian engineering sector, with a diversified portfolio spanning automotive components, bicycles, metal-formed products, and precision steel tubes. As of April 2025, the stock has experienced significant volatility, prompting investors to closely examine its fundamentals and technical outlook.
📊 Fundamental Overview
Valuation Metrics:
Financial Performance:
Tube Investments of India Ltd (NSE: TIINDIA) is exhibiting a classic double bottom pattern on the daily chart, signaling potential reversal strength. While fundamentals reflect a strong industrial play with high valuation multiples, the technical setup suggests a critical moment for traders to watch.
📉 Technical Analysis (Daily Timeframe)
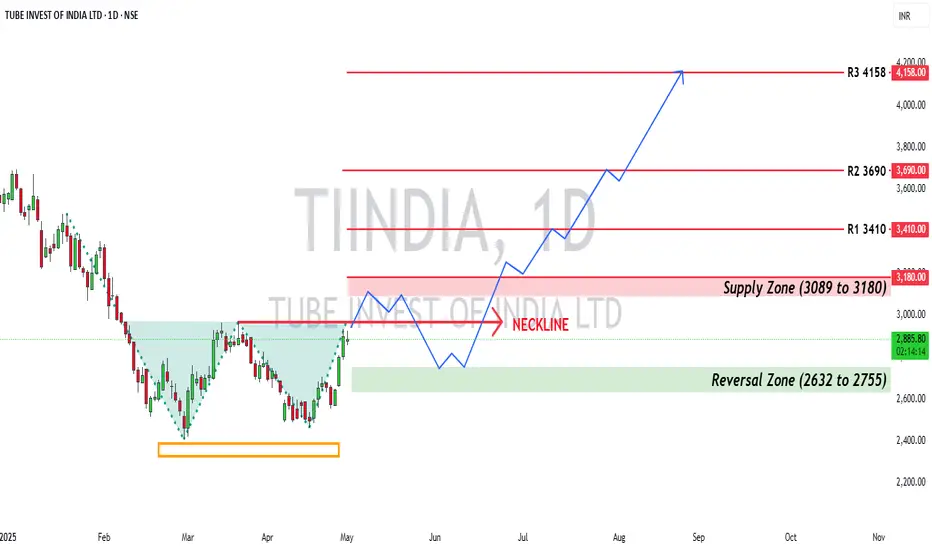
Pattern: Double Bottom
Neckline Breakout Zone: ~₹2,967.50
🟨 Immediate Supply Zone: ₹3,089 – ₹3,180
🟩 Support Zone (Bottom Reversal Area): ₹2,632 – ₹2,755
🔺 Major Resistance Levels (Above Breakout):
📌 Conclusion
TIINDIA is at a make-or-break juncture on the charts. A decisive breakout above ₹3,180 could drive strong upside momentum toward ₹3,410 and beyond. However, traders should watch for a rejection near the supply zone and possible retest of the lower support band before a confirmed move.
📊 Fundamental Overview
Valuation Metrics:
- Price-to-Earnings (P/E) Ratio: Approximately 61.5, indicating a premium valuation compared to industry peers.
- Price-to-Book (P/B) Ratio: Around 9.4, suggesting the stock is trading at a high multiple of its book value.
- Earnings Per Share (EPS): ₹42.43, reflecting the company's profitability.
Financial Performance:
- Revenue (TTM): ₹182.5 billion.
- Net Income (TTM): ₹8.13 billion.
- Gross Margin: 31.38%.
- Net Profit Margin: 4.45%.
Tube Investments of India Ltd (NSE: TIINDIA) is exhibiting a classic double bottom pattern on the daily chart, signaling potential reversal strength. While fundamentals reflect a strong industrial play with high valuation multiples, the technical setup suggests a critical moment for traders to watch.
📉 Technical Analysis (Daily Timeframe)
Pattern: Double Bottom
Neckline Breakout Zone: ~₹2,967.50
- Current Structure: The stock has formed a double bottom and is now consolidating near the neckline, awaiting a decisive breakout.
🟨 Immediate Supply Zone: ₹3,089 – ₹3,180
- This zone is expected to act as a resistance barrier.
- A rejection from here is possible on the first test, especially if volume doesn’t confirm the breakout.
🟩 Support Zone (Bottom Reversal Area): ₹2,632 – ₹2,755
- If rejection occurs at the supply zone, this region may provide buy-on-dip opportunities.
- Historically respected as a strong demand zone.
🔺 Major Resistance Levels (Above Breakout):
- ₹3,410 (first major breakout target)
- ₹3,690 (medium-term resistance)
- ₹4,158 (long-term breakout target)
📌 Conclusion
TIINDIA is at a make-or-break juncture on the charts. A decisive breakout above ₹3,180 could drive strong upside momentum toward ₹3,410 and beyond. However, traders should watch for a rejection near the supply zone and possible retest of the lower support band before a confirmed move.
כתב ויתור
המידע והפרסומים אינם מיועדים להיות, ואינם מהווים, ייעוץ או המלצה פיננסית, השקעתית, מסחרית או מכל סוג אחר המסופקת או מאושרת על ידי TradingView. קרא עוד ב־תנאי השימוש.
כתב ויתור
המידע והפרסומים אינם מיועדים להיות, ואינם מהווים, ייעוץ או המלצה פיננסית, השקעתית, מסחרית או מכל סוג אחר המסופקת או מאושרת על ידי TradingView. קרא עוד ב־תנאי השימוש.