Description:
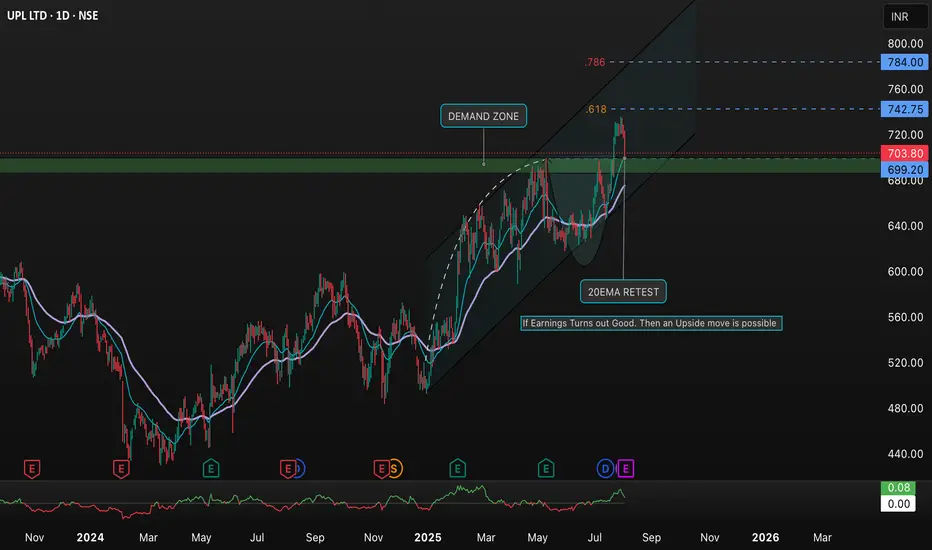
This chart analyzes UPL LTD (NSE:UPL) on the daily timeframe. Key highlights include:
• Demand Zone: The chart marks a demand zone where buying interest is expected to be strong.
• Fibonacci Levels: Major resistance at the 0.618 and 0.786 Fibonacci retracement zones (around 720 and 784).
• Current Price Action: Stock is trading near 703.80, showing a recent pullback after testing higher levels.
• 20EMA Retest: The price recently retested the 20 EMA, a critical support.
• Upside Potential: Watch for an upside move if upcoming earnings turn out positive. Key upside targets: 742, 760, and 784.
• Strategy Note: Monitor the demand zone for support and watch for breakouts above resistance for potential bullish confirmation.
Ideal for traders looking to capitalize on support/resistance and trend-following strategies.
כתב ויתור
המידע והפרסומים אינם מיועדים להיות, ואינם מהווים, ייעוץ או המלצה פיננסית, השקעתית, מסחרית או מכל סוג אחר המסופקת או מאושרת על ידי TradingView. קרא עוד ב־תנאי השימוש.
כתב ויתור
המידע והפרסומים אינם מיועדים להיות, ואינם מהווים, ייעוץ או המלצה פיננסית, השקעתית, מסחרית או מכל סוג אחר המסופקת או מאושרת על ידי TradingView. קרא עוד ב־תנאי השימוש.