The US100 has seen multiple pullbacks of around 3.5% to 4% over the past week. However, each dip has been met with strong buying interest, leading to quick recoveries — indicating that these were bullish pullbacks, not trend reversals.
This kind of price action typically reflects underlying market strength, where investors view corrections as buying opportunities rather than signals of weakness.
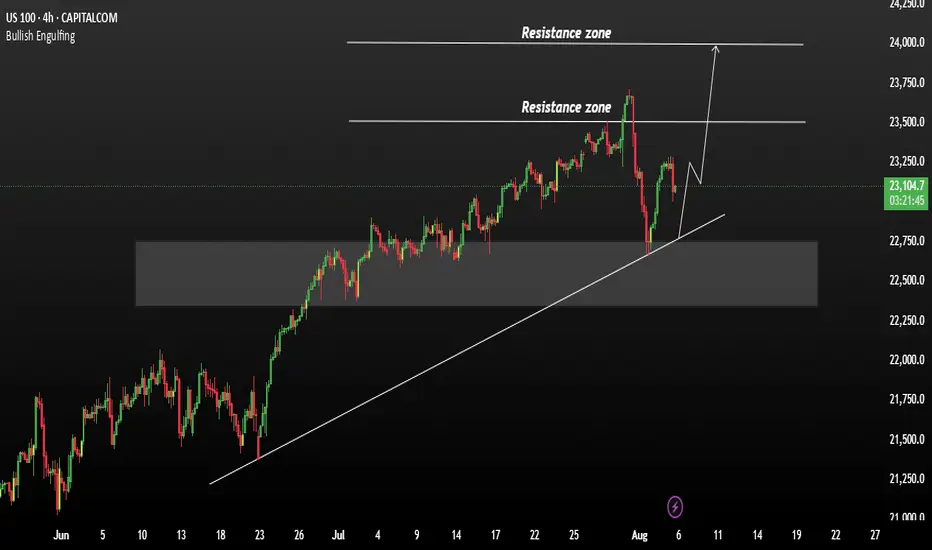
Key Technical Observations:
Each drop has been bought aggressively, suggesting a firm support base in the 22,700–23,000 region If this bullish momentum persists, US100 could retest recent highs and potentially break through, opening the path towards 23,500 and 2: 24,500
You May find more details in the chart.
Trade wisely best of Luck Buddies.
Ps: Support with like and comments for better analysis Thanks for understating.
This kind of price action typically reflects underlying market strength, where investors view corrections as buying opportunities rather than signals of weakness.
Key Technical Observations:
Each drop has been bought aggressively, suggesting a firm support base in the 22,700–23,000 region If this bullish momentum persists, US100 could retest recent highs and potentially break through, opening the path towards 23,500 and 2: 24,500
You May find more details in the chart.
Trade wisely best of Luck Buddies.
Ps: Support with like and comments for better analysis Thanks for understating.
עסקה פעילה
עסקה סגורה: היעד הושג
1st Target Reached
Join My telegram Channel
t.me/AnalysisGold2
Free Forex Signals
t.me/Jamessignals11
t.me/AnalysisGold2
Free Forex Signals
t.me/Jamessignals11
פרסומים קשורים
כתב ויתור
המידע והפרסומים אינם מיועדים להיות, ואינם מהווים, ייעוץ או המלצה פיננסית, השקעתית, מסחרית או מכל סוג אחר המסופקת או מאושרת על ידי TradingView. קרא עוד ב־תנאי השימוש.