There is growing market speculation that the Fed may tolerate inflation above 2% for longer, consistent with its Average Inflation Targeting (AIT) framework introduced in 2020.
This also implies that real rates i.e., nominal rates minus inflation are likely to fall significantly. Given this, we anticipate gold to continue trending higher as the U.S. dollar's purchasing power erodes with mounting debt, persistently higher inflation, and falling real yields.
What is QE?
Quantitative Easing (QE) refers to the Fed injecting liquidity into financial markets by purchasing large quantities of assets such as Mortgage-Backed Securities (MBS) and U.S. Treasuries, especially during periods of economic stress like the Global Financial Crisis (2007–2008) and the COVID-19 downturn.
How Does QE Work?
- Asset Purchases: The Fed buys large volumes of Treasuries and MBS from financial institutions.
- Balance Sheet Expansion: These purchases expand the Fed's balance sheet (now hovering near $6.6 trillion, per FRED).
- Increased Liquidity: Banks receive excess reserves in exchange, increasing system-wide liquidity.
- Lower Interest Rates: Demand for bonds pushes prices higher and yields lower.
- Economic Stimulus: Lower borrowing costs promote credit creation, investment, and consumer spending.
However, a key drawback of QE is asset price inflation. As seen between the GFC and the COVID-19 pandemic, low rates and excess liquidity drove significant appreciation in equities, housing, and other financial assets, even while consumer inflation remained near target.
QE vs. Stimulus Checks
If traditional interest rate policy is Monetary Policy 1 (MP1), then QE is MP2. Stimulus checks, or government handouts, fall under MP, a fusion of monetary and fiscal policy.
While QE primarily injects liquidity into financial institutions, stimulus checks inject purchasing power directly into households. This approach where the Treasury issues debt and the Fed purchases that debt, stimulates demand for real goods and services. We saw this during the post-COVID recovery, which brought a sharp rebound in consumer activity but also a surge in inflation, reaching a peak of 9.1% in June 2022 (CPI YoY).
- QE impacts Asset Price Inflation
- Stimulus Checks impact Goods & Services Inflation
What is YCC? (Yield Curve Control)
Yield Curve Control (YCC) is a policy whereby the central bank buys government debt across various maturities to control yields not just at the short end (via rates), but across the entire yield curve.
A prime example is the Bank of Japan, which has used YCC since 2016 to anchor 10-year JGB yields near zero. The Fed has not formally adopted YCC, but market participants believe it may lean in that direction in the future especially during crises where long-end rates rise undesirably. Mounting US debt and rising long end yields may prompt the Fed to step in and adopt YCC like BoJ has done previously.
- Front-End Control: Managed via policy rates
- Long-End Control: Central bank buys 5Y, 10Y, 20Y, 30Y Treasuries to anchor yields
Potential Risks of YCC:
- Credibility Risk: If inflation rises while the central bank suppresses yields, it may lose market trust.
- Currency Pressure: Artificially low yields may trigger speculative pressure on the currency (as seen with the yen under BoJ YCC).
We’ve kept this concise and digestible for now, but there’s more to unpack—especially on the long-term implications of coordinated monetary-fiscal policy (MP3), debt sustainability, and central bank credibility.
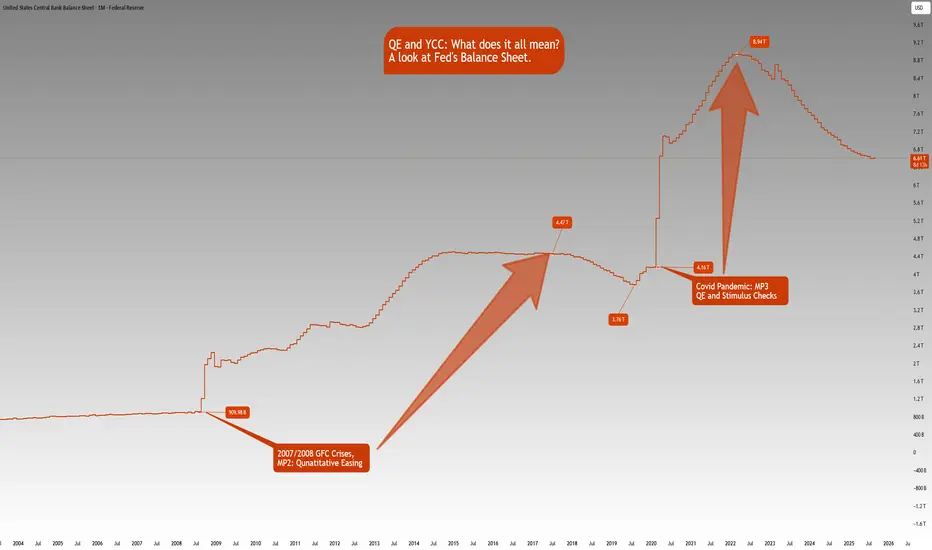
The Fed’s balance sheet chart shows how Fed’s balance sheet has increased:
- Aug 1, 2008: $909.98B
- Jul 1, 2017: $4.47T
- Aug 1, 2019: $3.76T
- Feb 1, 2020: $4.16T
- Mar 1, 2022: $8.94T
- Aug 1, 2025: $6.61T
Note that this is not just a US phenomenon. It is a world wide phenomena looking at many of the developed and emerging markets. The Debt to GDP ratios are increasing, Central Banks balance sheets are rising in tandem with rising government debt.
With the rate cutting cycle starting, it is a matter of time that we also see QE restarting.
If you’d like us to dive deeper into any of these topics in future educational blogs, let us know. We're happy to build on this foundation with more insights.
EdgeClear
P: 773.832.8320
Derivatives trading involves a substantial risk of loss. Past performance is not indicative of future results. Any example trades are not inclusive of fees and commissions.
P: 773.832.8320
Derivatives trading involves a substantial risk of loss. Past performance is not indicative of future results. Any example trades are not inclusive of fees and commissions.
פרסומים קשורים
כתב ויתור
המידע והפרסומים אינם מיועדים להיות, ואינם מהווים, ייעוץ או המלצה פיננסית, השקעתית, מסחרית או מכל סוג אחר המסופקת או מאושרת על ידי TradingView. קרא עוד ב־תנאי השימוש.