PROTECTED SOURCE SCRIPT
מעודכן RTW Moving Averages
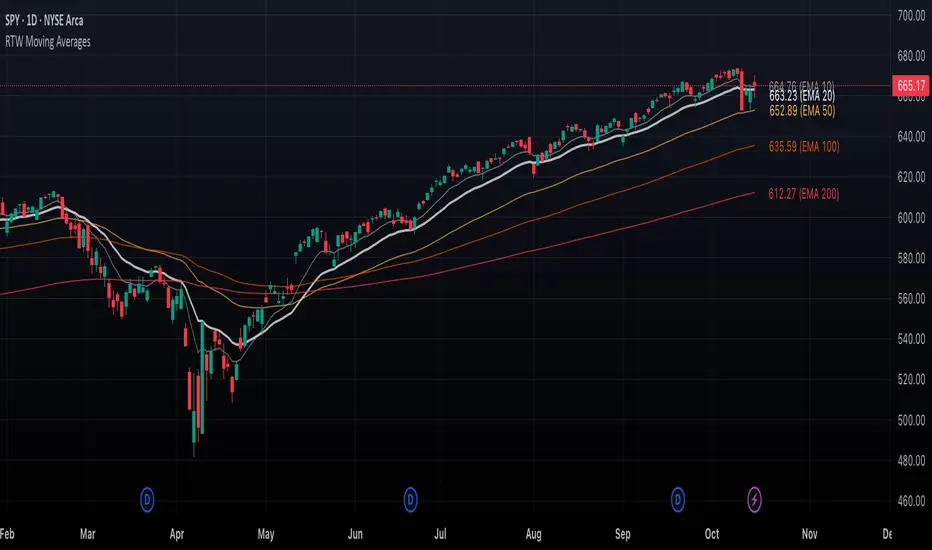
This clean, overlay-style indicator displays 10 moving averages—five EMAs and five SMAs—using the most widely followed trading periods: 10, 20, 50, 100, and 200. Each moving average is carefully color-coded and styled with distinct opacity levels, where EMAs are more prominent and SMAs more subtle, ensuring maximum readability without chart clutter.
Key Features
5 EMAs + 5 SMAs with standard trading periods (10, 20, 50, 100, 200).
Multi-timeframe support, allowing traders to track confluence across different chart intervals.
Distraction-free interface—settings are hidden by default for a clean look.
Overlay indicator works with all chart types and layouts.
Thoughtful color scheme for quick recognition:
10 Period: Light Gray
20 Period: White (most prominent)
50 Period: Orange
100 Period: Dark Orange
200 Period: Red
How Swing Traders Use It
For swing traders, moving averages aren’t just trend filters—they act as dynamic support and resistance levels. This indicator highlights the levels institutions and seasoned traders often watch closely:
Interaction Points: When price approaches or wicks into a key EMA or SMA, it often signals where liquidity lies and where reactions may occur.
Trend Continuation Setups: A long candle wick rejecting off a moving average (e.g., the 20 EMA or 50 SMA) can suggest strong institutional defense of the trend, creating entry opportunities with defined risk.
Swing Levels: The 100 and 200-period averages, in particular, are major reference points for trend direction and can mark high-probability reversal or continuation zones.
Multi-Timeframe Confluence: By enabling different timeframe averages, traders can spot overlapping levels (e.g., a daily 50 EMA aligning with a 4H 200 SMA) that act as stronger decision zones.
Perfect Use Cases
Trend Analysis: Quickly determine whether the market is in an uptrend, downtrend, or range.
Support & Resistance Identification: Use moving averages as zones where price is likely to react.
Confluence Trading: Combine MA levels across timeframes to pinpoint high-probability trade locations.
הערות שחרור
* Added MA name on the chart (configurable)* Added MA values on the chart (configurable)
סקריפט מוגן
סקריפט זה פורסם כמקור סגור. עם זאת, תוכל להשתמש בו בחופשיות וללא כל מגבלות – למד עוד כאן
כתב ויתור
המידע והפרסומים אינם מיועדים להיות, ואינם מהווים, ייעוץ או המלצה פיננסית, השקעתית, מסחרית או מכל סוג אחר המסופקת או מאושרת על ידי TradingView. קרא עוד ב־תנאי השימוש.
סקריפט מוגן
סקריפט זה פורסם כמקור סגור. עם זאת, תוכל להשתמש בו בחופשיות וללא כל מגבלות – למד עוד כאן
כתב ויתור
המידע והפרסומים אינם מיועדים להיות, ואינם מהווים, ייעוץ או המלצה פיננסית, השקעתית, מסחרית או מכל סוג אחר המסופקת או מאושרת על ידי TradingView. קרא עוד ב־תנאי השימוש.