OPEN-SOURCE SCRIPT
200SMA Distance Oscillator
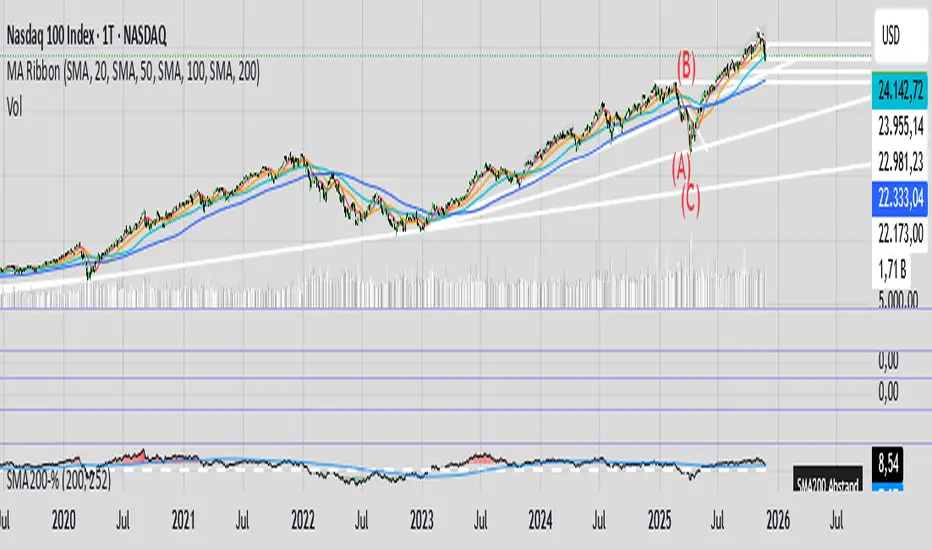
The oscillator measures the percentage deviation of closing price x from SMA200.
The idea behind the oscillator was preceded by an analysis of how often MAs in the index hold/bounce or are broken through.
Basically, the idea was about index analysis, i.e., the macro picture of a market.
Who wants to buy individual stocks when the overall market is plummeting ;-)
Or in other words: How long are you long in a market? When is it time to take profits?
After the analysis of the stability of SMAs in the index was rather modest (ratio of just under 6:4 for bounce to breakout – overall in 20, 50, 100, and 200 frames from 2020 to 2025), it was noticeable that the percentage over- or underperformance was scalable, especially in indices.
And since indices generally move upwards, there were fixed limits for over- and underestimations – especially in the longer term (SMA200) – unlike with individual stocks.
It is therefore more a question of macro trends and less of short-term movements, e.g., in day trading.
It was now interesting to see at what percentage range counter-movements were likely – particularly in the positive range for profit-taking, but of course also in the negative range for entry into sold-off markets.
If, for example, closing prices around +25% above SMA200 were reached in the NDX, the probability is very high that the market has overreacted and an interim correction will follow – so the theory goes.
On the other hand, continuous levels of +5 to +10% are a product of healthy positive development in a bull market and do not necessarily require action.
The oscillator was specifically designed for the NDX, but can also be used for the SPX and others.
The style was based on the RSI, so that the color level rises from 10% to 20% (overbought/oversold principle).
Based on manually examined movements, the criteria were set as follows:
+/-10% = flow / no color background
> +/-10% = border areas / color background
The center line represents the 252 average of the percentage deviations and could also be used as a trigger, provided it has been historically examined and is valid.
The oscillator is very interesting because it behaves completely differently from one financial instrument to another and, as a result, also in the timeframes (4h, D, W).
It would probably make sense to change the flow and border levels in the code when using it outside of indices.
The fact is that the oscillator must be “adjusted” to each instrument in order to achieve its goal of providing the best possible prediction. “Adjusting” refers to the analysis of the levels at which an instrument/asset usually reacts.
As with all indicators and oscillators, it is advisable to take other indicators and, in particular, macro news into account when analyzing this development.
If I find any substantial correlations with other indicators, I will be happy to provide an update.
The idea came from me, the code from Grok.
The code is not 100% perfect, but the data (percentage deviation, color background) is correct according to initial analysis.
In the settings, you can make the lines of the plots invisible. This makes the oscillator clearer. You can also adjust the settings for the average line.
סקריפט קוד פתוח
ברוח האמיתית של TradingView, יוצר הסקריפט הזה הפך אותו לקוד פתוח, כך שסוחרים יוכלו לעיין בו ולאמת את פעולתו. כל הכבוד למחבר! אמנם ניתן להשתמש בו בחינם, אך זכור כי פרסום חוזר של הקוד כפוף ל־כללי הבית שלנו.
כתב ויתור
המידע והפרסומים אינם מיועדים להיות, ואינם מהווים, ייעוץ או המלצה פיננסית, השקעתית, מסחרית או מכל סוג אחר המסופקת או מאושרת על ידי TradingView. קרא עוד ב־תנאי השימוש.