OPEN-SOURCE SCRIPT
מעודכן Multi-Timeframe Stoch RSI Dashboard
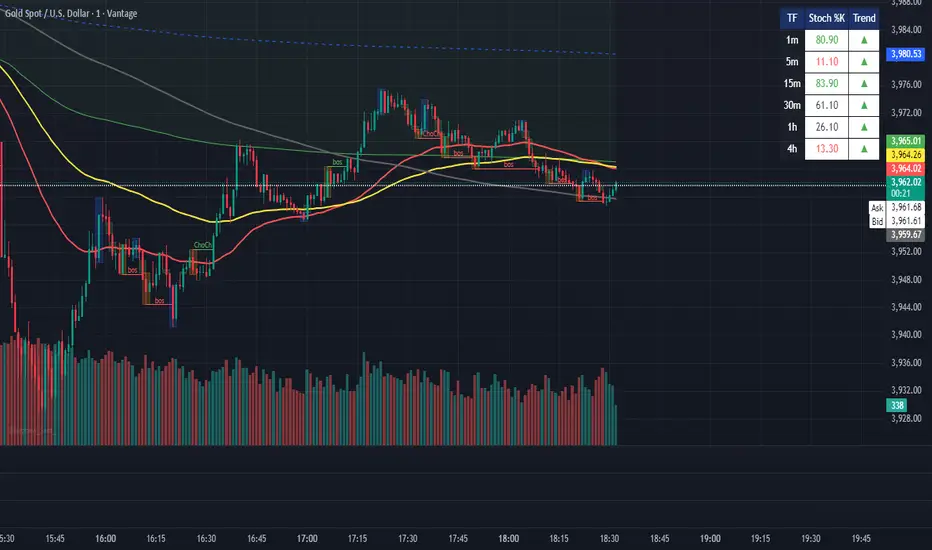
Shows the Stoch RSI values for different timeframes in a box on the top right corner.
1m
5m
15m
30m
1h
4h
Above 80 = green
Below 20 = red
Black = between 20 and 80.
1m
5m
15m
30m
1h
4h
Above 80 = green
Below 20 = red
Black = between 20 and 80.
הערות שחרור
Version 2 where values are correct when switching timeframes.הערות שחרור
Added trend arrows to show the direction of the trend of the Stoch RSI.סקריפט קוד פתוח
ברוח TradingView אמיתית, היוצר של הסקריפט הזה הפך אותו לקוד פתוח, כך שסוחרים יכולים לבדוק ולאמת את הפונקציונליות שלו. כל הכבוד למחבר! למרות שאתה יכול להשתמש בו בחינם, זכור שפרסום מחדש של הקוד כפוף לכללי הבית שלנו.
כתב ויתור
המידע והפרסומים אינם אמורים להיות, ואינם מהווים, עצות פיננסיות, השקעות, מסחר או סוגים אחרים של עצות או המלצות שסופקו או מאושרים על ידי TradingView. קרא עוד בתנאים וההגבלות.
סקריפט קוד פתוח
ברוח TradingView אמיתית, היוצר של הסקריפט הזה הפך אותו לקוד פתוח, כך שסוחרים יכולים לבדוק ולאמת את הפונקציונליות שלו. כל הכבוד למחבר! למרות שאתה יכול להשתמש בו בחינם, זכור שפרסום מחדש של הקוד כפוף לכללי הבית שלנו.
כתב ויתור
המידע והפרסומים אינם אמורים להיות, ואינם מהווים, עצות פיננסיות, השקעות, מסחר או סוגים אחרים של עצות או המלצות שסופקו או מאושרים על ידי TradingView. קרא עוד בתנאים וההגבלות.