PROTECTED SOURCE SCRIPT
Drawdown % + STD Bands: Log-Scale Macro Tool
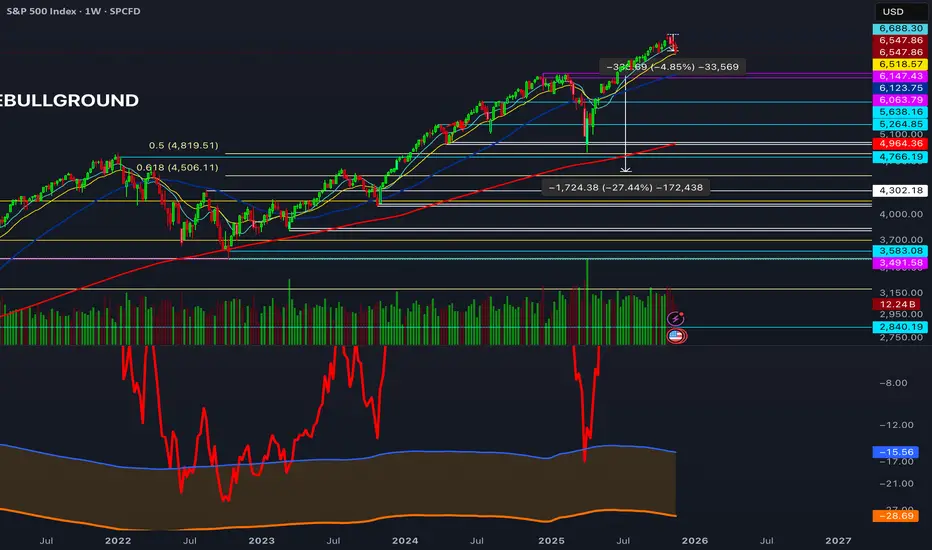
Description: The exact indicator big-macro accounts use: tracks real-time drawdown from the rolling 252-period peak, then plots -1σ (blue) and -2σ (orange) bands on a clean percent scale. Built for weekly charts-shows if a stock, index, or crypto is statistically cheap (hit -1σ) or generational-buy territory (-2σ). Works flawlessly on SPX, Nasdaq, Bitcoin, Gold, Tesla... anything. How to Use (read it aloud like a voice memo): 1. Slap this under any chart, set to weekly timeframe . 2. Flip the price pane to log scale -zero negotiations. 3. Watch the thick red line: • Hovering 0 %? Bullish noise, chill. • Kissing blue (-10 % to -25 %)? Start loading-happens every 1-2 years. • Touching orange (-30 %+)? Panic sale finished. Buy like rent money's burning a hole. 4. Zoom out five-ten years; monthly works too if you want lazy vibes. Daily? Trash-too twitchy. Pro tip: Name your watchlist Panic Plays, drop this in, and ping me when MELI or GOOGL hits orange. I'll confirm if it's actually stupid-cheap.
סקריפט מוגן
סקריפט זה פורסם כמקור סגור. עם זאת, תוכל להשתמש בו בחופשיות וללא כל מגבלות – למד עוד כאן
כתב ויתור
המידע והפרסומים אינם מיועדים להיות, ואינם מהווים, ייעוץ או המלצה פיננסית, השקעתית, מסחרית או מכל סוג אחר המסופקת או מאושרת על ידי TradingView. קרא עוד ב־תנאי השימוש.
סקריפט מוגן
סקריפט זה פורסם כמקור סגור. עם זאת, תוכל להשתמש בו בחופשיות וללא כל מגבלות – למד עוד כאן
כתב ויתור
המידע והפרסומים אינם מיועדים להיות, ואינם מהווים, ייעוץ או המלצה פיננסית, השקעתית, מסחרית או מכל סוג אחר המסופקת או מאושרת על ידי TradingView. קרא עוד ב־תנאי השימוש.