INVITE-ONLY SCRIPT
E.B. Strategy

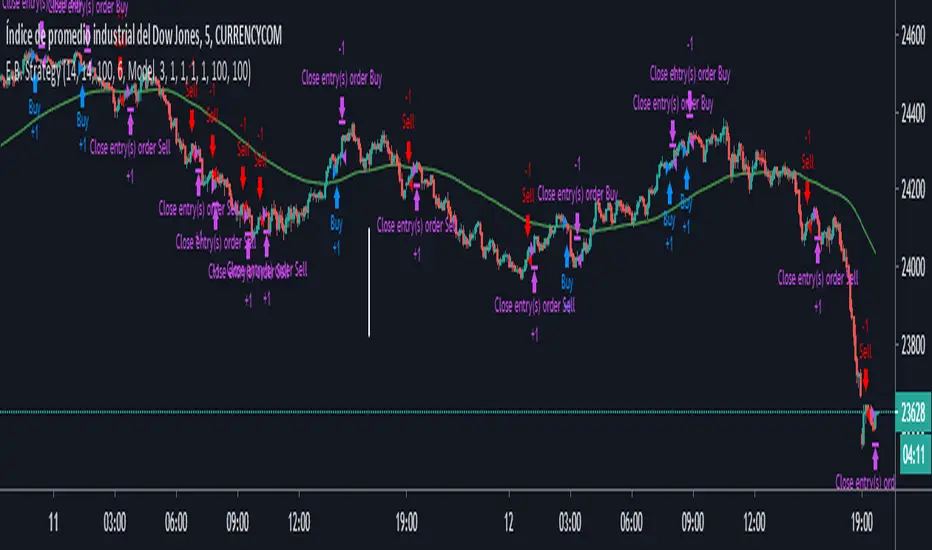
This strategy use a custom indicator. When the green line cross above the level 6, it's going to sell the stock. When cross down -6, it's going to buy the stock. You can change the level's number to adapt it to any asset.
It works for US30, or any Dow's Futures . But you can adapt it to any market, FOREX/Crypto/Stocks.
Also it works better in 5/15 min chart, but you can adapt it to any resolution too.
We use EMA 100 and ADX 14 as a filter of the indicator.
EntryModel is the level to make Buy and Sell transactions.
ExitModel is the level to close transactions.
In TPandSL you can choose:
No -> if you want only buy and sell, without closing transactions.
Model -> you will use the ExitModel parameter to close transactions.
% -> if you want to use a percentage of TP and SL.
Volatility -> to adapt TP and SL with the volatility of the moment.
Pips -> if you want to use Pips to close transactions.
If you would like to have the access, just DM me!
סקריפט להזמנה בלבד
הגישה לסקריפט זה מוגבלת למשתמשים שהוסמכו על ידי הכותב ובדרך כלל דורשת תשלום. אתה יכול להוסיף אותו למועדפים שלך, אך תוכל להשתמש בו רק לאחר שתבקש אישור ותקבל אותו מהמחבר שלו. למידע נוסף, צור קשר עם EntrenamientoBursatil, או עקוב אחר הוראות המחבר למטה.
TradingView לא מציעה לשלם עבור סקריפט ולהשתמש בו אלא אם כן אתה סומך ב-100% על המחבר שלו ומבין כיצד הסקריפט עובד. במקרים רבים, אתה יכול למצוא אלטרנטיבה טובה לקוד פתוח בחינם בבסקריפטים הקהילתיים שלנו.
הוראות המחבר
″
רוצה להשתמש בסקריפ זה בגרף?
אזהרה: נא לקרוא לפני בקשת גישה.
כתב ויתור
המידע והפרסומים אינם אמורים להיות, ואינם מהווים, עצות פיננסיות, השקעות, מסחר או סוגים אחרים של עצות או המלצות שסופקו או מאושרים על ידי TradingView. קרא עוד בתנאים וההגבלות.