Gambit Stoch RSI Grid v1.5
This indicator was designed to be used with the Gambit Trading Suite, but may also be used as a standalone indicator.
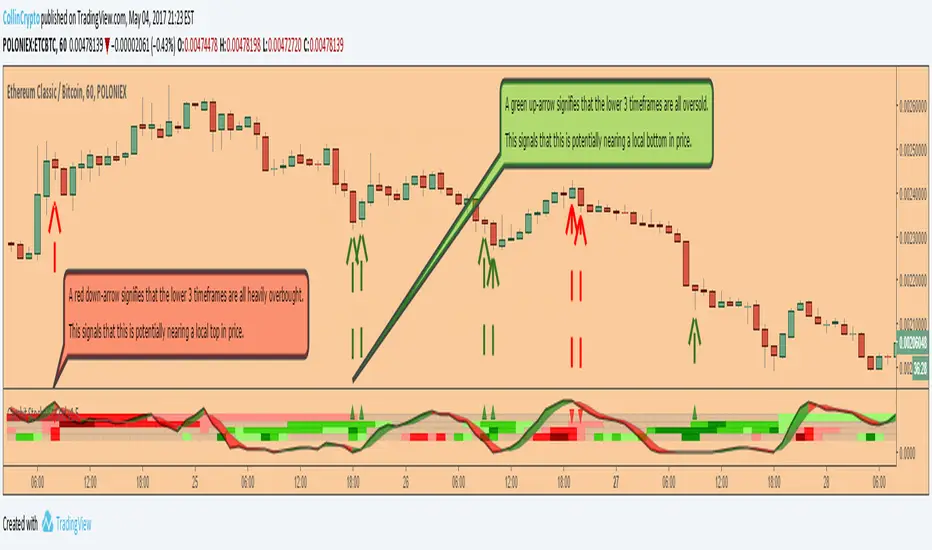
This indicator highlights StochRSI overbought/oversold values for 1D, 2H, 1H, & 30m timeframes (From top to bottom. Timeframes can be changed in settings).
If the lower three timeframes are all overbought/oversold, a direction arrow will show, suggesting the direction of the trend. By default, there are four available timeframes tracked, three of which are low timeframe and one is for a quick-glance at the 1D. Only the lower three are utilized for printing arrow signals. These arrows can be disabled in the config.
Lighter coloured arrows show the same signal, but a weaker version. These are disabled by default but may be turned on for early warnings.
Try this indicator for FREE! Leave a comment below and we will give you access to the trading suite generally within 24 hours.
סקריפט להזמנה בלבד
רק משתמשים שאושרו על ידי המחבר יכולים לגשת לסקריפט הזה. יהיה עליך לשלוח בקשת גישה ולקבל אישור לשימוש. בדרך כלל, הגישה ניתנת לאחר תשלום. למידע נוסף, עקוב אחר ההוראות של היוצר בהמשך או צור קשר עם CollinCrypto ישירות.
TradingView לא ממליצה לשלם עבור סקריפט או להשתמש בו אלא אם כן אתה סומך לחלוטין על המחבר שלו ומבין כיצד הוא פועל. ייתכן שתוכל גם למצוא חלופות חינמיות וקוד פתוח ב-סקריפטים הקהילתיים שלנו.
הוראות המחבר
כתב ויתור
סקריפט להזמנה בלבד
רק משתמשים שאושרו על ידי המחבר יכולים לגשת לסקריפט הזה. יהיה עליך לשלוח בקשת גישה ולקבל אישור לשימוש. בדרך כלל, הגישה ניתנת לאחר תשלום. למידע נוסף, עקוב אחר ההוראות של היוצר בהמשך או צור קשר עם CollinCrypto ישירות.
TradingView לא ממליצה לשלם עבור סקריפט או להשתמש בו אלא אם כן אתה סומך לחלוטין על המחבר שלו ומבין כיצד הוא פועל. ייתכן שתוכל גם למצוא חלופות חינמיות וקוד פתוח ב-סקריפטים הקהילתיים שלנו.