OPEN-SOURCE SCRIPT
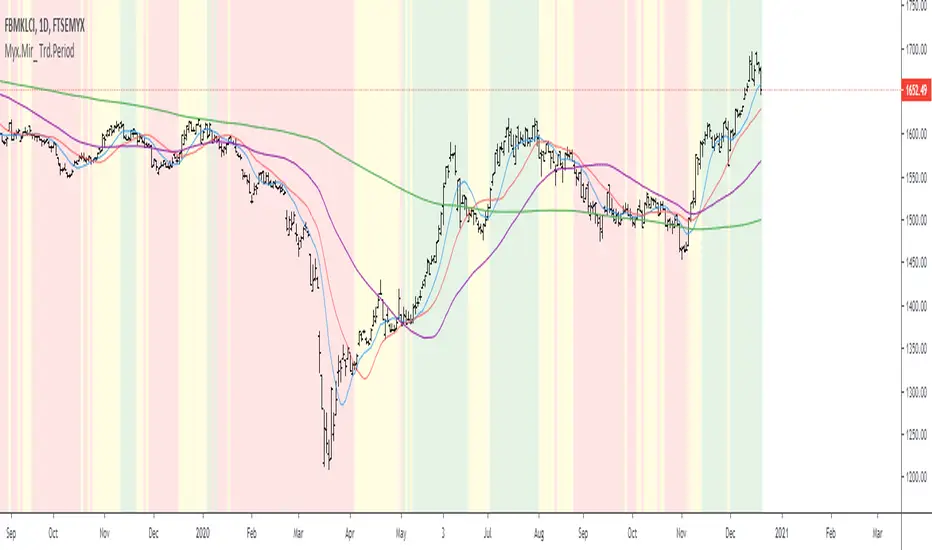
Myx.Mir_ Trd.Period c/w Background Color

Myx.Mir_ Trd.Period c/w Background Color
FBMKLCI is a main Indices/ references
Basis = Based on Simple Moving Average
Note:-
BG= Background Color
Based on personal study:-
BG is Green = Current index > MA 20 > MA 50 = Sign of Bullish // majority portfolio should be in green & make profit... Hehehe
BG is Yellow = MA50 < Current Index < MA 20 = No solid direction and/or sideways // ----------------------------------------------------... should plan to hold or exit
BG is Red = Current Index < MA 50 = Sign of Bearish // majority of portfolio should be in red... Hehehe. Should be run Fast Fast.....
can do your own Trade Record Based on 3 phases [BG Green, Yellow, Red]
a) When the strategy/ Technique are perform better @ more gain and Don't chase the price ... "nanti asal Kejar Pucuks Je price terus Droppp..." Hehe.
b) When the strategy / Technique not perform well...
סקריפט קוד פתוח
ברוח האמיתית של TradingView, יוצר הסקריפט הזה הפך אותו לקוד פתוח, כך שסוחרים יוכלו לעיין בו ולאמת את פעולתו. כל הכבוד למחבר! אמנם ניתן להשתמש בו בחינם, אך זכור כי פרסום חוזר של הקוד כפוף ל־כללי הבית שלנו.
כתב ויתור
המידע והפרסומים אינם מיועדים להיות, ואינם מהווים, ייעוץ או המלצה פיננסית, השקעתית, מסחרית או מכל סוג אחר המסופקת או מאושרת על ידי TradingView. קרא עוד ב־תנאי השימוש.