OPEN-SOURCE SCRIPT
Triple Weekly Moving Average

Triple Weekly Moving Average
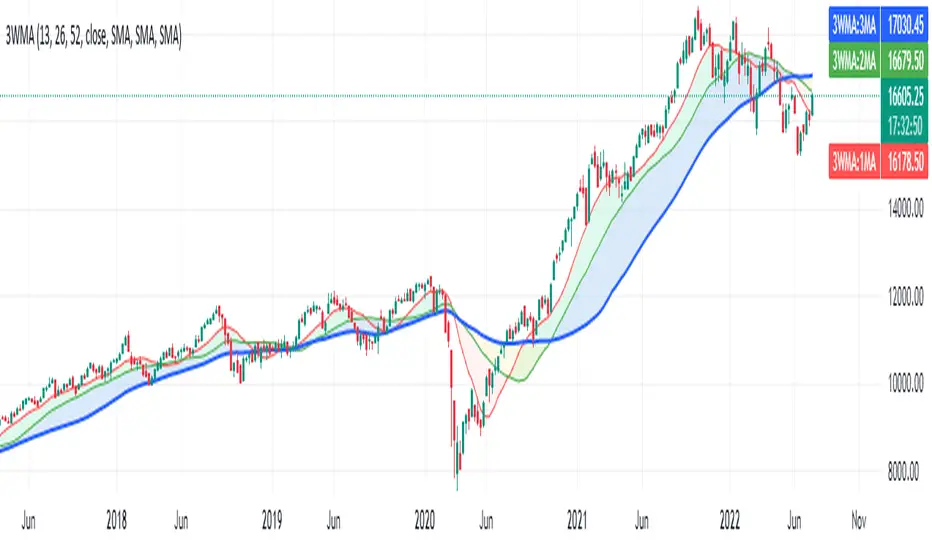
The default settings plot 3 weekly moving averages [SMA] for 13, 26 and 52 weeks, for analyzing Short (Quarterly), Medium (Semester) and long term (Yearly) view.
Idea is when the three moving averages are aligned, the security is in trend and when they crisscross the security may be either turning, slowing down or stalling, however, this must be correlated with other studies.
Started observing half yearly moving average after reading Stan Weinstein's Secrets For Profiting in Bull and Bear Markets.
The settings of the indicator are pretty self explanatory. The indicator gives an option to select lookahead, however, change it only when you are well aware of the consequences, the default setting is Turned Off, please follow TV user guide for a detailed explanation on lookahead. I added it as I was plotting this script on Daily timeframe and wanted to observe the changes.
סקריפט קוד פתוח
ברוח האמיתית של TradingView, יוצר הסקריפט הזה הפך אותו לקוד פתוח, כך שסוחרים יוכלו לעיין בו ולאמת את פעולתו. כל הכבוד למחבר! אמנם ניתן להשתמש בו בחינם, אך זכור כי פרסום חוזר של הקוד כפוף ל־כללי הבית שלנו.
כתב ויתור
המידע והפרסומים אינם מיועדים להיות, ואינם מהווים, ייעוץ או המלצה פיננסית, השקעתית, מסחרית או מכל סוג אחר המסופקת או מאושרת על ידי TradingView. קרא עוד ב־תנאי השימוש.