OPEN-SOURCE SCRIPT
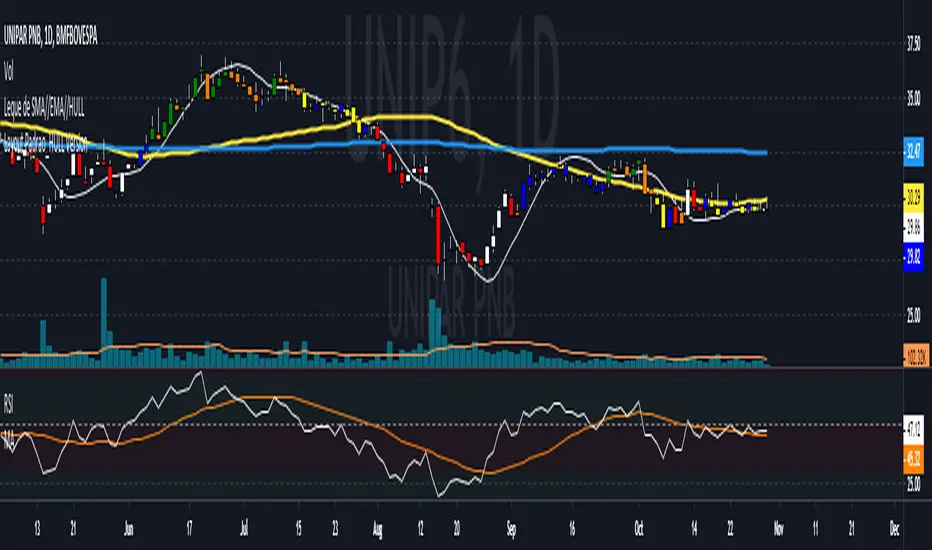
Layout Padrao_HULL Version

This layout was inspired by the Andre Machado´s Tabajara set of rules.
The adaptation are the following:
-Usage of Hull Average instead of simple moving average
-Usage of 2 Averages instead of just one
-Implementation of a "transition zone"
Average Candle Color
p1 // p2 // Prior
> // > // > Set Color 1
> // > // < Set in your layout settings color (down candle)
> // < // > Set Color A1
> // < // < Set Color A2
< // > // > Set Color A1
< // > // < Set Color A2
< // < // > Set in your layout settings color (up candle)
< // < // < Set Color 2
The A1 // A2 colors are for the transition zone.
Either the average 1 or the average 2 will be lower than the previous average.
This is a way to show how both averages are developing without having to look at 2 additional lines, making the layout more clear (at least, for me).
Feel free to comment
PS: Thank you for all the people who have implemented Machado´s work in pine editor
סקריפט קוד פתוח
ברוח האמיתית של TradingView, יוצר הסקריפט הזה הפך אותו לקוד פתוח, כך שסוחרים יוכלו לעיין בו ולאמת את פעולתו. כל הכבוד למחבר! אמנם ניתן להשתמש בו בחינם, אך זכור כי פרסום חוזר של הקוד כפוף ל־כללי הבית שלנו.
כתב ויתור
המידע והפרסומים אינם מיועדים להיות, ואינם מהווים, ייעוץ או המלצה פיננסית, השקעתית, מסחרית או מכל סוג אחר המסופקת או מאושרת על ידי TradingView. קרא עוד ב־תנאי השימוש.