OPEN-SOURCE SCRIPT
מעודכן Chips Average Line (volume price) by RSU
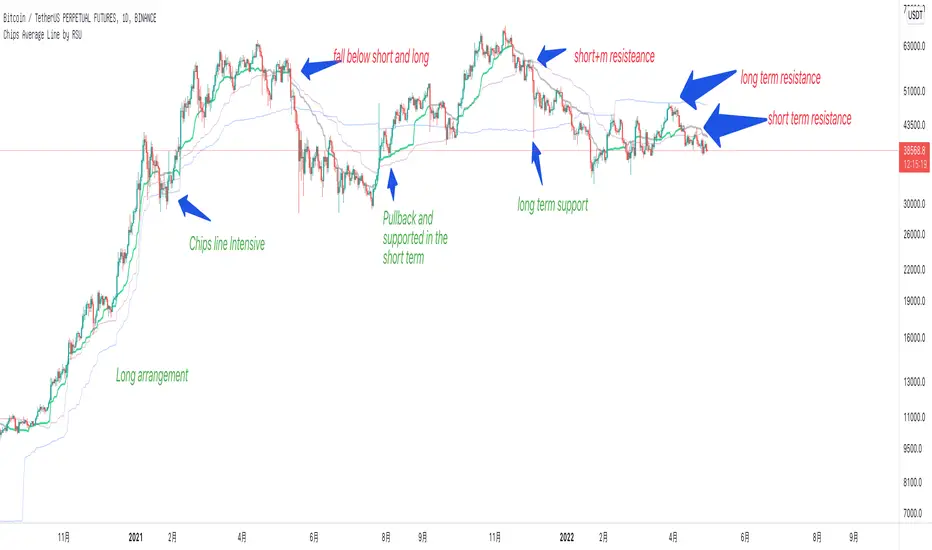
This is a very important volume-price indicator for me.
Displays the average cost of chips for the short term (30 days), medium term (60 days), and long term (200 days).
Chip lines act as support and resistance. The longer the trend days, the greater the strength.
usage:
1. Breakout: If the stock rises, it must be above the short-term chip line. And gradually rise.
2. Sequence: When a bullish trend is formed, the short-term stack is higher than the mid-term stack, and the mid-flag stack is higher than the long-term stack. When there is a bear trend, the order is reversed.
3. Intensive: When the three chip lines are dense, there will be a periodical resonance effect, and the long-term trend will rise or fall sharply
הערות שחרור
Added smoothing parameter to reduce the jaggedness of the indicator.הערות שחרור
Changes:All timeframes are supported.סקריפט קוד פתוח
ברוח האמיתית של TradingView, יוצר הסקריפט הזה הפך אותו לקוד פתוח, כך שסוחרים יוכלו לעיין בו ולאמת את פעולתו. כל הכבוד למחבר! אמנם ניתן להשתמש בו בחינם, אך זכור כי פרסום חוזר של הקוד כפוף ל־כללי הבית שלנו.
כתב ויתור
המידע והפרסומים אינם מיועדים להיות, ואינם מהווים, ייעוץ או המלצה פיננסית, השקעתית, מסחרית או מכל סוג אחר המסופקת או מאושרת על ידי TradingView. קרא עוד ב־תנאי השימוש.
סקריפט קוד פתוח
ברוח האמיתית של TradingView, יוצר הסקריפט הזה הפך אותו לקוד פתוח, כך שסוחרים יוכלו לעיין בו ולאמת את פעולתו. כל הכבוד למחבר! אמנם ניתן להשתמש בו בחינם, אך זכור כי פרסום חוזר של הקוד כפוף ל־כללי הבית שלנו.
כתב ויתור
המידע והפרסומים אינם מיועדים להיות, ואינם מהווים, ייעוץ או המלצה פיננסית, השקעתית, מסחרית או מכל סוג אחר המסופקת או מאושרת על ידי TradingView. קרא עוד ב־תנאי השימוש.