PROTECTED SOURCE SCRIPT
CC - ATR Bands
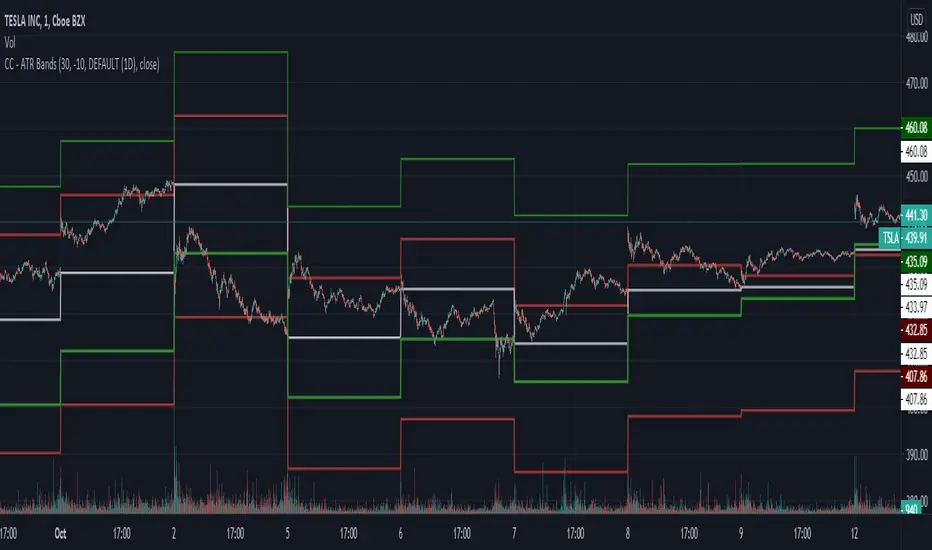
Plots ATR bands around candles at any HTF resolution you desire, taken in through the inputs. The white line represents the open of the HTF, the red and green the expected boundaries. You can use the risk tolerance slider up/down to adjust how risky you want to be with the ATR bands.
I am not responsible for outcomes using this method, indicator or anything else. Please do your own due diligence.
I am not responsible for outcomes using this method, indicator or anything else. Please do your own due diligence.
סקריפט מוגן
סקריפט זה פורסם כמקור סגור. עם זאת, תוכל להשתמש בו בחופשיות וללא כל מגבלות – למד עוד כאן
All of these scripts are sponsored by NChart, as he has graciously given me money for trading view premium to help me develop scripts! Check my bio for more information and a link to their twitter. Mods if this is not okay DM me, thanks! Apologies.
כתב ויתור
המידע והפרסומים אינם מיועדים להיות, ואינם מהווים, ייעוץ או המלצה פיננסית, השקעתית, מסחרית או מכל סוג אחר המסופקת או מאושרת על ידי TradingView. קרא עוד ב־תנאי השימוש.