OPEN-SOURCE SCRIPT
מעודכן Crypto Price Volatility Range
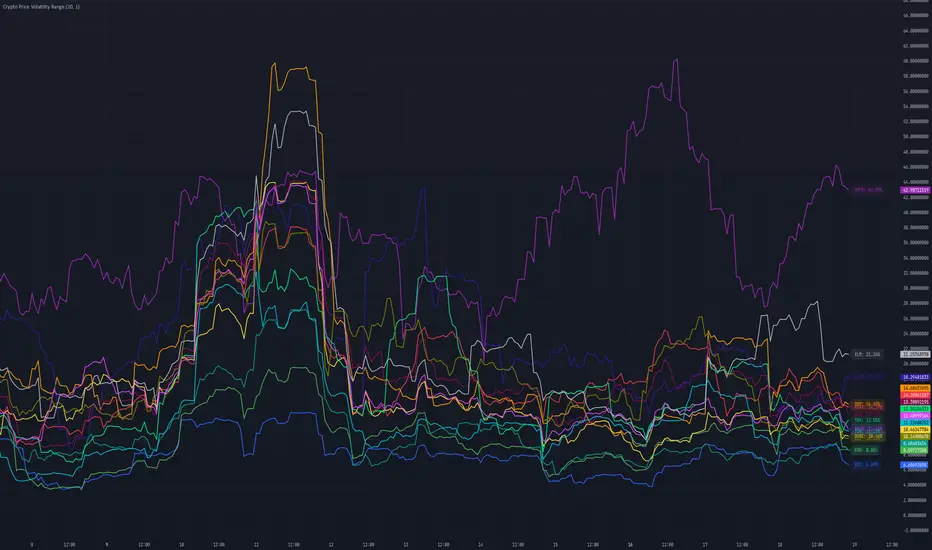
# Cryptocurrency Price Volatility Range Indicator
This TradingView indicator is a visualization tool for tracking historical volatility across multiple major cryptocurrencies.
## Features
- Real-time volatility tracking for 14 major cryptocurrencies
- Customizable period and standard deviation multiplier
- Individual color coding for each currency pair
- Optional labels showing current volatility values in percentage
## Supported Cryptocurrencies
- Bitcoin (BTC)
- Ethereum (ETH)
- Avalanche (AVAX)
- Dogecoin (DOGE)
- Hype (HYPE)
- Ripple (XRP)
- Binance Coin (BNB)
- Cardano (ADA)
- Tron (TRX)
- Chainlink (LINK)
- Shiba Inu (SHIB)
- Toncoin (TON)
- Sui (SUI)
- Stellar (XLM)
## Settings
- **Period**: Timeframe for volatility calculation (default: 20)
- **Standard Deviation Multiplier**: Multiplier for standard deviation (default: 1.0)
- **Show Labels**: Toggle label display on/off
## Calculation Method
The indicator calculates volatility using the following method:
1. Calculate daily logarithmic returns
2. Compute standard deviation over the specified period
3. Annualize (multiply by √252)
4. Convert to percentage (×100)
## Usage
1. Add the indicator to your TradingView chart
2. Adjust parameters as needed
3. Monitor volatility lines for each cryptocurrency
4. Enable labels to see precise current volatility values
## Notes
- This indicator displays in a separate window, not as an overlay
- Volatility values are annualized
- Data for each currency pair is sourced from USD pairs
הערות שחרור
Translate commentsהערות שחרור
Update chartסקריפט קוד פתוח
ברוח האמיתית של TradingView, יוצר הסקריפט הזה הפך אותו לקוד פתוח, כך שסוחרים יוכלו לעיין בו ולאמת את פעולתו. כל הכבוד למחבר! אמנם ניתן להשתמש בו בחינם, אך זכור כי פרסום חוזר של הקוד כפוף ל־כללי הבית שלנו.
Made by 🌸
כתב ויתור
המידע והפרסומים אינם מיועדים להיות, ואינם מהווים, ייעוץ או המלצה פיננסית, השקעתית, מסחרית או מכל סוג אחר המסופקת או מאושרת על ידי TradingView. קרא עוד ב־תנאי השימוש.
סקריפט קוד פתוח
ברוח האמיתית של TradingView, יוצר הסקריפט הזה הפך אותו לקוד פתוח, כך שסוחרים יוכלו לעיין בו ולאמת את פעולתו. כל הכבוד למחבר! אמנם ניתן להשתמש בו בחינם, אך זכור כי פרסום חוזר של הקוד כפוף ל־כללי הבית שלנו.
Made by 🌸
כתב ויתור
המידע והפרסומים אינם מיועדים להיות, ואינם מהווים, ייעוץ או המלצה פיננסית, השקעתית, מסחרית או מכל סוג אחר המסופקת או מאושרת על ידי TradingView. קרא עוד ב־תנאי השימוש.