Smoothed Candles
How should I use it ? This is just a example to be used with this indicator.
Let's assume that we are looking for sell opportunities.
- step 1: identify some (at least 3) positives (green) candles with a good volume, excluding consolidation regions.
- step 2: wait for negative (red) candles with a good volume and also all previous candles must be by majority green.
- step 3: wait for pullback with high volume or consolidation region to close the position.
The example can be better described in the image below:
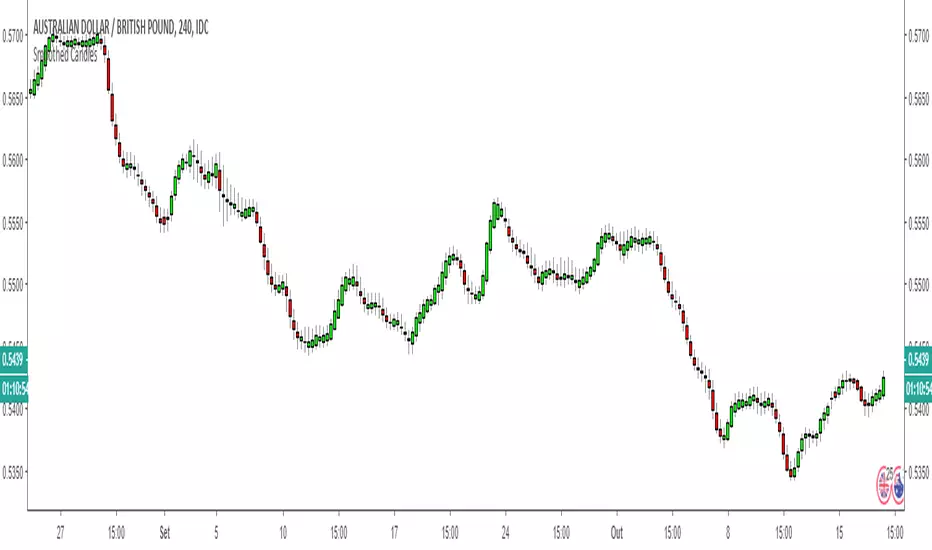
Another example os use, displayed in the image below:
Look how makes it easy to identify tops and bottoms.
Very easy to indetify trends:
Very easy to indetify pullbacks:
It can be used with almost of pairs!
If you are interested in purchase, access the link below:
2450ca2f.ngrok.io/home
סקריפט להזמנה בלבד
רק משתמשים שאושרו על ידי המחבר יכולים לגשת לסקריפט הזה. יהיה עליך לשלוח בקשת גישה ולקבל אישור לשימוש. בדרך כלל, הגישה ניתנת לאחר תשלום. למידע נוסף, עקוב אחר ההוראות של היוצר בהמשך או צור קשר עם FranciscoBiaso ישירות.
TradingView לא ממליצה לשלם עבור סקריפט או להשתמש בו אלא אם כן אתה סומך לחלוטין על המחבר שלו ומבין כיצד הוא פועל. ייתכן שתוכל גם למצוא חלופות חינמיות וקוד פתוח ב-סקריפטים הקהילתיים שלנו.
הוראות המחבר
כתב ויתור
סקריפט להזמנה בלבד
רק משתמשים שאושרו על ידי המחבר יכולים לגשת לסקריפט הזה. יהיה עליך לשלוח בקשת גישה ולקבל אישור לשימוש. בדרך כלל, הגישה ניתנת לאחר תשלום. למידע נוסף, עקוב אחר ההוראות של היוצר בהמשך או צור קשר עם FranciscoBiaso ישירות.
TradingView לא ממליצה לשלם עבור סקריפט או להשתמש בו אלא אם כן אתה סומך לחלוטין על המחבר שלו ומבין כיצד הוא פועל. ייתכן שתוכל גם למצוא חלופות חינמיות וקוד פתוח ב-סקריפטים הקהילתיים שלנו.