OPEN-SOURCE SCRIPT
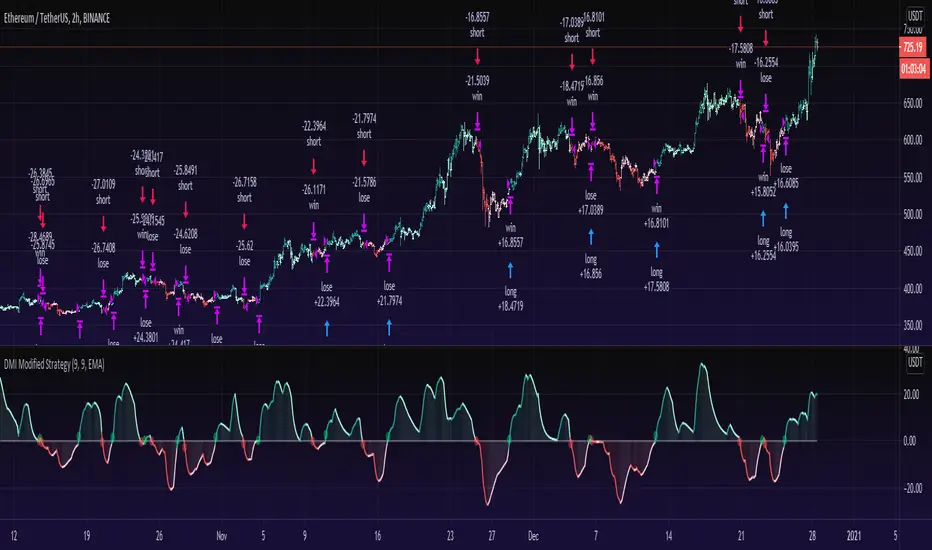
DMI Modified Strategy

As promised a strategy of my DMI Modified indicator! (See link below for indicator).
=== How does it work? ===
Instead of plotting the positive direction of +DI and negative direction for -DI, we subtract the +DI with the -DI on scales of 100 to -100.
The result is plotted with a oscillator to identify the current trend.
DMI Modified supports multiple moving averages (default is EMA with length of 9). You can disable moving averages smoothing in settings.
//== About the Strategy ==
Buys when the line crosses over the Zero line.
Sells when the line crosses under the Zero line.
The DMI modified strategy is pretty much clean, without any filtering besides the DMI Modified and a moving average to smooth it.
Works best to catch a trend and more suitable for 1 hour and above time frame. Stay tuned for updates.
On sideways you will get more false signals. as i said , it's a clean version without much bells and whistles for you to experiment.
== Oscillator Colors ==
GREEN : Strong Up Trend as DMI Modified is above zero line and DMI modified is ascending.
LIGHT GREEN: Still up trend but weakening as DMI modified is above zero but descending.
RED: Strong Downtrend as DMI Modified is below zero line and DMI modified is descending.
LIGHT RED: Still down trending but weakening as DMI modified is below zero but ascending.
== Notes ==
Short is enabled by default.
Bar coloring is disabled by default.
== Links ==
DMI modified indicator:
Like if you like and Enjoy! Follow for more upcoming indicators/strategies: tradingview.com/u/dman103/
=== How does it work? ===
Instead of plotting the positive direction of +DI and negative direction for -DI, we subtract the +DI with the -DI on scales of 100 to -100.
The result is plotted with a oscillator to identify the current trend.
DMI Modified supports multiple moving averages (default is EMA with length of 9). You can disable moving averages smoothing in settings.
//== About the Strategy ==
Buys when the line crosses over the Zero line.
Sells when the line crosses under the Zero line.
The DMI modified strategy is pretty much clean, without any filtering besides the DMI Modified and a moving average to smooth it.
Works best to catch a trend and more suitable for 1 hour and above time frame. Stay tuned for updates.
On sideways you will get more false signals. as i said , it's a clean version without much bells and whistles for you to experiment.
== Oscillator Colors ==
GREEN : Strong Up Trend as DMI Modified is above zero line and DMI modified is ascending.
LIGHT GREEN: Still up trend but weakening as DMI modified is above zero but descending.
RED: Strong Downtrend as DMI Modified is below zero line and DMI modified is descending.
LIGHT RED: Still down trending but weakening as DMI modified is below zero but ascending.
== Notes ==
Short is enabled by default.
Bar coloring is disabled by default.
== Links ==
DMI modified indicator:

Like if you like and Enjoy! Follow for more upcoming indicators/strategies: tradingview.com/u/dman103/
סקריפט קוד פתוח
ברוח האמיתית של TradingView, יוצר הסקריפט הזה הפך אותו לקוד פתוח, כך שסוחרים יוכלו לעיין בו ולאמת את פעולתו. כל הכבוד למחבר! אמנם ניתן להשתמש בו בחינם, אך זכור כי פרסום חוזר של הקוד כפוף ל־כללי הבית שלנו.
Appreciation of my work: paypal.me/dman103
All Premium indicators: algo.win
LIVE Stream - Pivot Points Algo: youtube.com/channel/UCFyqab-i0xb2jf-c18ufH0A/live
All Premium indicators: algo.win
LIVE Stream - Pivot Points Algo: youtube.com/channel/UCFyqab-i0xb2jf-c18ufH0A/live
כתב ויתור
המידע והפרסומים אינם מיועדים להיות, ואינם מהווים, ייעוץ או המלצה פיננסית, השקעתית, מסחרית או מכל סוג אחר המסופקת או מאושרת על ידי TradingView. קרא עוד ב־תנאי השימוש.