Trend Identifier
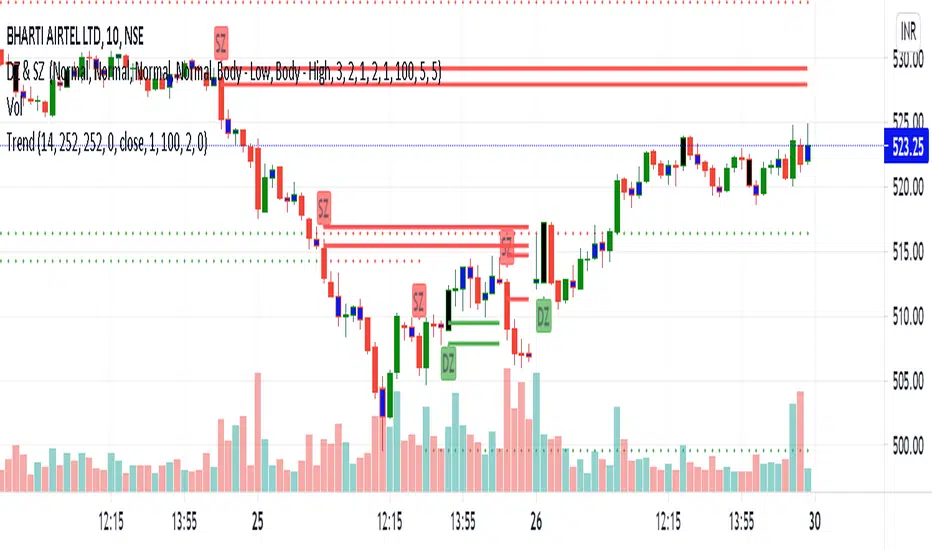
It shows the trend and RSI position for Intraday, Daily and Swing time-frame in one go.
IF RSI is > 70 = RSI High
RSI is < 65 > 35 = RSI Side
RSI is < 30 = RSI Low
For Trend High, Low and Side, it makes it's own calculation and identifies the trend for intermediate time frame.
It also shows the standard deviation information.
1sd = 1 standard deviation achieved.
2sd = 2 standard deviation achieved.
Weekly and Monthly std = Weekly and Monthly standard deviation achieved.
Based on your trading style one can hide the other trend std and RSI option.
PM us to obtain the access.
- Added Pivot support and Resistance which will compliment the Demand and Supply zones.
סקריפט להזמנה בלבד
רק משתמשים שאושרו על ידי המחבר יכולים לגשת לסקריפט הזה. יהיה עליך לשלוח בקשת גישה ולקבל אישור לשימוש. בדרך כלל, הגישה ניתנת לאחר תשלום. למידע נוסף, עקוב אחר ההוראות של היוצר בהמשך או צור קשר עם SupplyIsInDemand ישירות.
TradingView לא ממליצה לשלם עבור סקריפט או להשתמש בו אלא אם כן אתה סומך לחלוטין על המחבר שלו ומבין כיצד הוא פועל. ייתכן שתוכל גם למצוא חלופות חינמיות וקוד פתוח ב-סקריפטים הקהילתיים שלנו.
הוראות המחבר
כתב ויתור
סקריפט להזמנה בלבד
רק משתמשים שאושרו על ידי המחבר יכולים לגשת לסקריפט הזה. יהיה עליך לשלוח בקשת גישה ולקבל אישור לשימוש. בדרך כלל, הגישה ניתנת לאחר תשלום. למידע נוסף, עקוב אחר ההוראות של היוצר בהמשך או צור קשר עם SupplyIsInDemand ישירות.
TradingView לא ממליצה לשלם עבור סקריפט או להשתמש בו אלא אם כן אתה סומך לחלוטין על המחבר שלו ומבין כיצד הוא פועל. ייתכן שתוכל גם למצוא חלופות חינמיות וקוד פתוח ב-סקריפטים הקהילתיים שלנו.