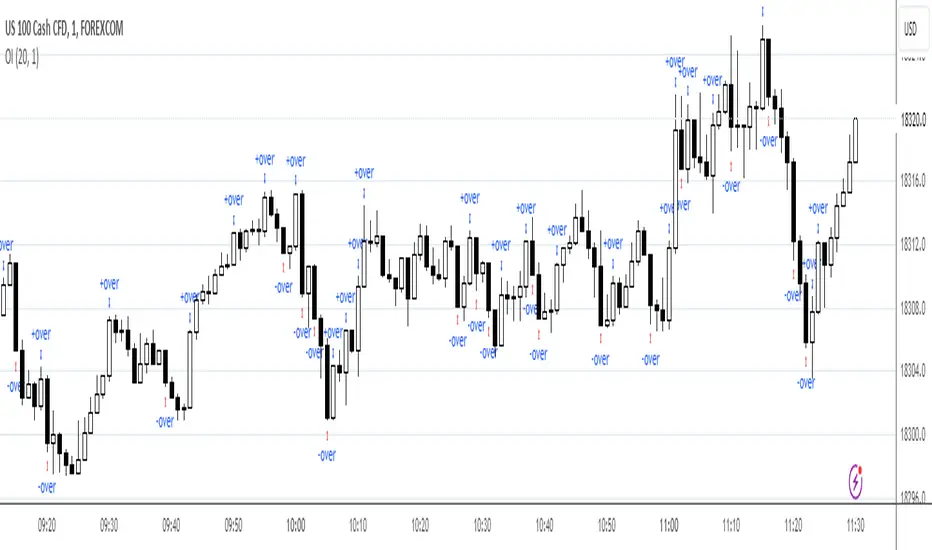
Overreaction indicator

Overreaction Indicator (OI)
Class: overreaction indicator
Trading type: intraday trading
Time frame: 1 day
Purpose: momentum/contrarian trading
Level of aggressiveness: standard
Overreaction Indicator is designed for intraday trading purposes. The indicator is based on the Overreaction Hypothesis. According to this hypothesis, after an abnormally strong rise/fall in price, the next day the contrarian price movement follows.
There are statistically significant differences between intraday dynamics on days with abnormal price changes and normal days respectively.
There is a strong momentum effect on days with abnormal price changes, i.e. prices tend to change only in the direction of the abnormal price changes during the whole day; in addition, usually the presence of an abnormal price movements becomes clear at the start of the US trading session.
During the Asian trading session a strong contrarian pattern is present (i.e., on the day after the overreaction prices tend to go in the opposite direction). Contrarian movement is limited in time, since usually it lasts only till the start of the European session.
There exist trading strategies that generate abnormal profits by exploiting the detected anomalies.
This indicator applies a dynamic trigger approach to detect daily abnormal price changes.
The indicator displays moments of market overreaction directly on the chart.
Parameters of the indicator
1. Averaging period (default value = 20) - period of indicator. It is used to define normal returns.
2. Number of Sigmas (number of standard deviations, default = 2) - Is used to detect abnormal returns. It defines levels of aggressiveness in trading signals. The bigger the value is the more conservative signals are generated
For the further information including the access to the indicator, please write in PM (private messages).
Class: overreaction indicator
Trading type: intraday trading
Time frame: 1 day
Purpose: momentum/contrarian trading
Level of aggressiveness: standard
Overreaction Indicator is designed for intraday trading purposes. The indicator is based on the Overreaction Hypothesis. According to this hypothesis, after an abnormally strong rise/fall in price, the next day the contrarian price movement follows.
There are statistically significant differences between intraday dynamics on days with abnormal price changes and normal days respectively.
There is a strong momentum effect on days with abnormal price changes, i.e. prices tend to change only in the direction of the abnormal price changes during the whole day; in addition, usually the presence of an abnormal price movements becomes clear at the start of the US trading session.
During the Asian trading session a strong contrarian pattern is present (i.e., on the day after the overreaction prices tend to go in the opposite direction). Contrarian movement is limited in time, since usually it lasts only till the start of the European session.
There exist trading strategies that generate abnormal profits by exploiting the detected anomalies.
This indicator applies a dynamic trigger approach to detect daily abnormal price changes.
The indicator displays moments of market overreaction directly on the chart.
Parameters of the indicator
1. Averaging period (default value = 20) - period of indicator. It is used to define normal returns.
2. Number of Sigmas (number of standard deviations, default = 2) - Is used to detect abnormal returns. It defines levels of aggressiveness in trading signals. The bigger the value is the more conservative signals are generated
Access to the indicator
Please address all questions about this indicator (including access to it) in private messages.
סקריפט להזמנה בלבד
רק משתמשים שאושרו על ידי המחבר יכולים לגשת לסקריפט הזה. יהיה עליך לשלוח בקשת גישה ולקבל אישור לשימוש. בדרך כלל, הגישה ניתנת לאחר תשלום. למידע נוסף, עקוב אחר ההוראות של היוצר בהמשך או צור קשר עם Trade24Fx ישירות.
TradingView לא ממליצה לשלם עבור סקריפט או להשתמש בו אלא אם כן אתה סומך לחלוטין על המחבר שלו ומבין כיצד הוא פועל. ייתכן שתוכל גם למצוא חלופות חינמיות וקוד פתוח ב-סקריפטים הקהילתיים שלנו.
הוראות המחבר
bit.ly/2oBvkHY
Больше информации на нашем ютьюб-канале
youtube.com/channel/UCYEOurJfasXWyYnrriGwsqQ
כתב ויתור
סקריפט להזמנה בלבד
רק משתמשים שאושרו על ידי המחבר יכולים לגשת לסקריפט הזה. יהיה עליך לשלוח בקשת גישה ולקבל אישור לשימוש. בדרך כלל, הגישה ניתנת לאחר תשלום. למידע נוסף, עקוב אחר ההוראות של היוצר בהמשך או צור קשר עם Trade24Fx ישירות.
TradingView לא ממליצה לשלם עבור סקריפט או להשתמש בו אלא אם כן אתה סומך לחלוטין על המחבר שלו ומבין כיצד הוא פועל. ייתכן שתוכל גם למצוא חלופות חינמיות וקוד פתוח ב-סקריפטים הקהילתיים שלנו.
הוראות המחבר
bit.ly/2oBvkHY
Больше информации на нашем ютьюб-канале
youtube.com/channel/UCYEOurJfasXWyYnrriGwsqQ