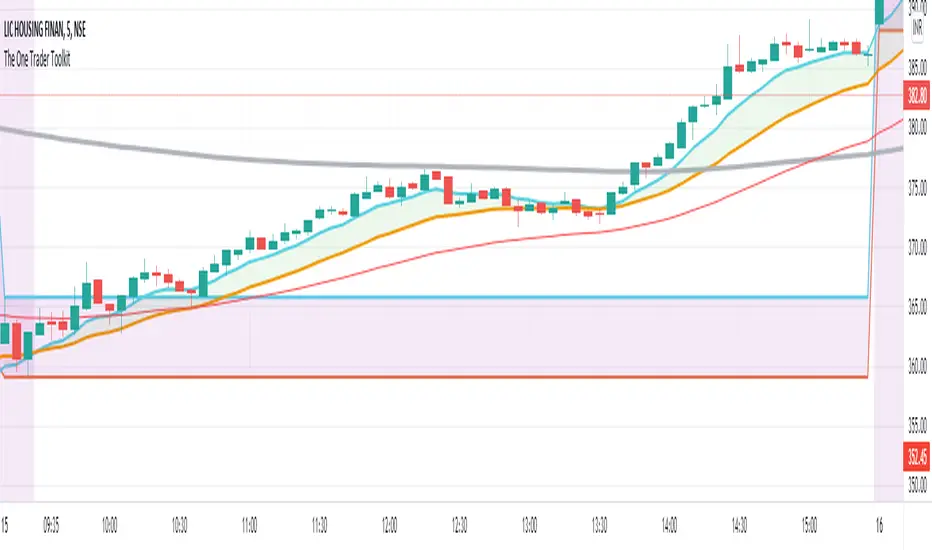
The One Trader Toolkit - Open AccessThis script is the open version of my existing invite-only script of the same name and has been opened for access to the community to use, but not modify or clone in any way.
This has been done as the invite-only script cannot be changed back to a public script and vice-versa, keeping in line with Tradingview House Rules.
The code is based on a full strategy that has been explained in detail as follows:
// Step 1:
// We will consider the 200ema a standard to assess the average price over the longer term.
// If the current price on the daily chart is seen above the 200ema, we will consider that the stock is in a long term uptrend.
// If the current price on the daily chart is seen below the 200ema, we will consider that the stock is in a long term downtrend.
// In order to assess the long term trend, a band is plotted between the CLOSE (Average price), HIGH (Average High Price), LOW (Average Low Price) of the last 200 days.
// This band has been color coded for easy visual recognition. Green fill between ema close and ema high. Red fill between ema close and ema low.
// The methodology explains that the trader should have a long bias when the price is above the green part of the band and a short bias while price is below the red part of the band.
// Step 2:
// Now we come to a lower timeframe analysis with the 200ema moving average on the hourly timeframe.
// This is marked by a very distinct solid blue line which cannot be missed.
// If the price is still above this moving average and correlates with the higher timeframe trend in step 1, then we will continue our analysis.
// Otherwise, the stock is not ready to be filtered down and we will move to another stock.
// Step 3:
// On the same hourly timeframe, we will continue further analysing the position of a red 50ema line as compared to the same blue 200ema line or a separetely plotted gray 200ema line.
// If the 50ema is above the blue or the gray 200ema line (and in correlation with trend in steps 1-3), then the stock is believed to be bullish.
// If the 50ema is below the blue or the gray 200ema line (and in correlation with trend in steps 1-3), then the stock is believed to be bearish.
// Step 4:
// After multiple confirmation of a continuing trend, we will try to ascertain a good entry point.
// On the one hour timeframe, we will apply the Phase Changer.
// Phase Changer configuration is derived from a common setup which includes the 8ema and 20ema lines.
// I have implemented it in the Indian stock market setup with an added theory that we ignore the Phase Changer position on any timeframe higher than hourly timeframe.
// So the Phase Changer is not only an indication of the continuing trend, but also a great indicator of what the price is trying to achieve through its interaction with the lines.
// If 8ema is above the 20ema on the hourly chart, then the stock is believed to be bullish.
// If 8ema is below the 20ema on the hourly chart, then the stock is believed to be bearish.
// The same will be done on 15 minutes timeframe.
// In either setup, if there is a pullback and price is touching any of the two ema lines and eventually gets rejected towards the continuing trend, then it is an indication of a good entry at the failure of the pullback.
// Step 5:
// After confirmation through Daily, Hourly and 15 minutes timeframes, we will now come to the execution (5 Minute) timeframe.
// Apply the breakfast range. This is the range formed during the first hour of trading.
// The high of the first hour and the low of the first hour form the breakfast breakout.
// This method is also widely known as Open Range Breakout (ORB).
// The breakfast range is commonly used for stock indices only on a Monday morning, we use it for all days of the week and mostly on stocks.
// If the breakout is consistent with the trend that we have been confirming since step 1, we will enter the trade.
// Step 6:
// An additional daily range has been plotted for those who would like to trade the breakout of the daily range.
// This is the sum of the open price of the day the range of the previous day.
// The green line is used as resistance and the red line is used as support.
// Any breakout of those lines will be considered a strong continuation of the trend, mostly until the end of the trading session.
// Miscellaneous
// The first hour of the trading day is marked yellow with a black solid bar marked at the end of the first hour.
// All trades will be taken only after 10:20am.
// Stoploss Settings
// We will be calculating stoploss with the help of the ATR values.
// I have defined two stop loss levels, one for safe traders and the other for aggressive traders.
// Safe traders will select the safe option in a long trade or short trade respectively and mark the stoploss indicated at the time of taking the breakout entry.
// Aggressive traders on the other hand will select the aggressive stop loss option in long or short trades respectively and mark the stoploss indicated at the time of taking the breakout entry.
מתנד אליגאטור
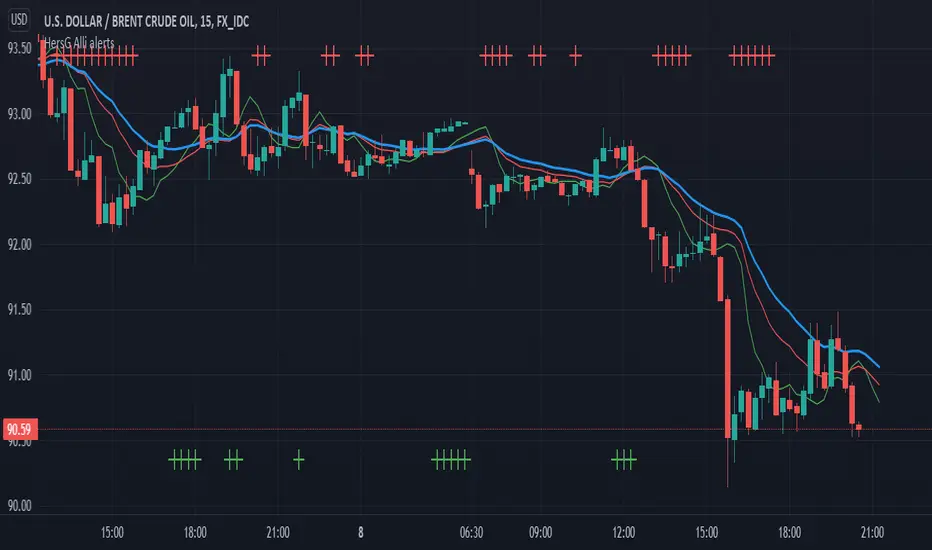
Alligator: Three signals confirmation with AlertsHello Trading Viewers,
The following is the William’s Alligator indicator with alerts indicating strong momentum, it can be used for scalping in lower time-frames or just riding the momentum in 1hr or 4hrs charts.
Input choices are:
1. Source of Data: Open, Low, High, Close, HL2, HLC3 and so on.
2. Simple and Exponential are the two choices of moving averages.
3. Lips, Teeth and Jaws input numbers are Fibonacci numbers with offsets from -4 to +4.
4. Up Momentum and Down Momentum signals will be plotted top and bottom of the charts respectively when conditions are met.
Idea used to confirm strong momentum
When (High + Low / 2) price is greater than Alligator’s Lips, Teeth, and Jaws, it is considered as a good time to go long; however, to strengthen the idea, the up-momentum condition needs to be approved three times consecutively. (Three consecutive candle bars should remain above Lips, Teeth, and Jaws to trigger an alert signal and plot Up- momentum shape on the charts)
The same idea with down-momentum, but the condition (High + Low / 2) price should be less than Alligator’s Lips, Teeth, and Jaws.
There is an alert set-up, once strong momentum is spotted it will send an alert once per bar close. You can relax and run an errand when the alert is not triggered.
Happy Trading!
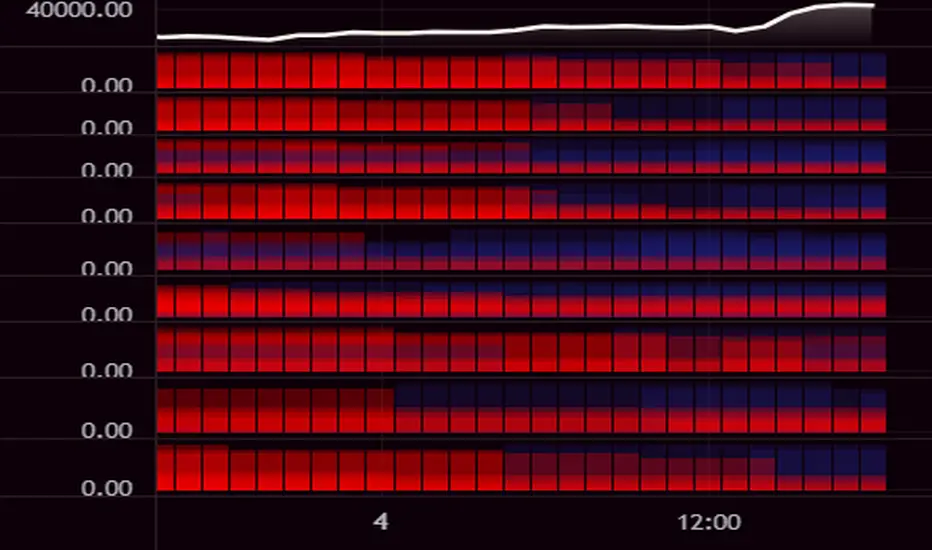
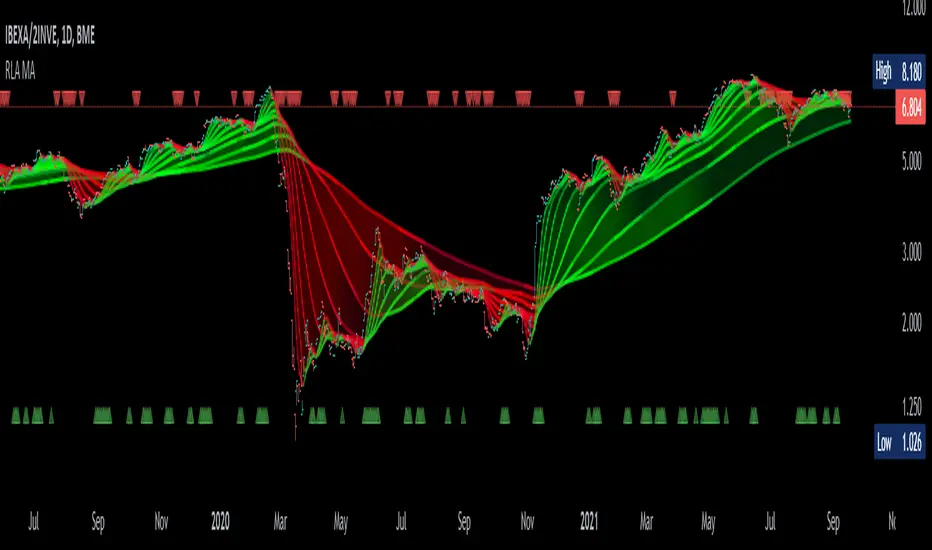
Williams Alligator Trend Filter HeatmapHello I've decided that the alligator lines can be used to find a trend. This script expands on that and checks 10 different multipliers to see trend over the long term and have 10 values. Those 10 values each give a color to one of the 10 lines in turn giving this Fire like plotting. I personaly use this to see if there is fear (red) in the markets or greed (blue), plotted 9 different crypto coins on the chart and have 4 columns in my setup to see the values on different timeframes. In the chart preview this is 1H,30M,10M,1M to see current environment. The colors use alot of data to generate especialy the bottom part, that colors based on a very long time zone.
Williams Alligator Trend FilterI've edited the normal Bill Williams Alligator indicator to have a color fill that indicates the trend. There is a percentage range filter which checks if the 2 outer lines are enough far away from eachother to indicate a trend. The indicator also checks if the lines are below or above eachother in the right order as a last check to confirm Trend

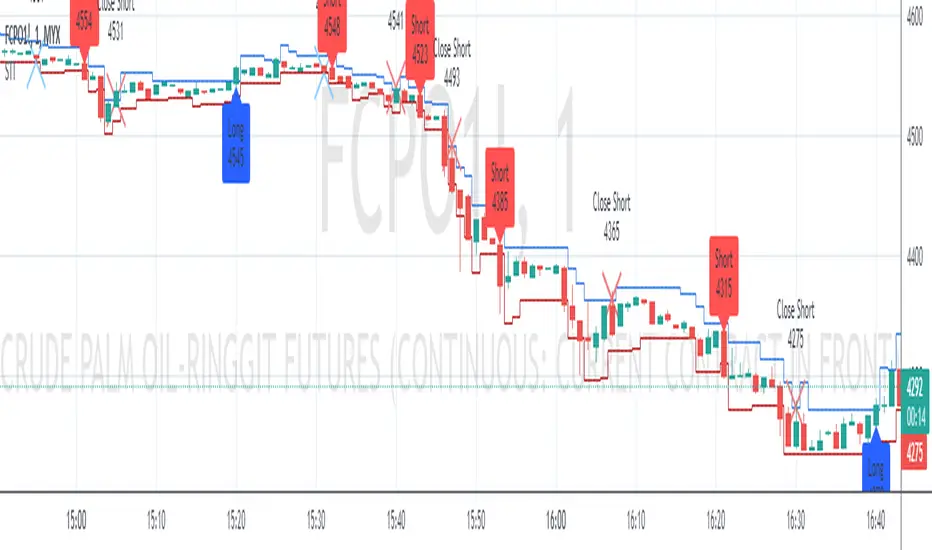
Swing Indicator (Tune for FCPO)Special indicator for FCPO (Crude Palm Oil Futures - Bursa Malaysia Derivative) traders but you can try another instrument.
Trend determination and buy/sell signals are using the Alligator system from Bill Williams.
To get maximum profit, the system uses the trailing stop technique using Average True Range (ATR) with 4 moving average options (RMA, SMA, EMA, WMA).
Please leave comments if any opinions.
Disclaimer
The content is in any event provided with the intention of being for general circulation and availability only. As such it is not intended to and does not form part of any offer or recommendation directed at you specifically, or have any regard to your investment objectives, financial situation, or needs of yourself or any other specific person. Before committing to a trade or investment, please seek advice from financial or other professional advisers regarding the suitability of the trade for you. If you do not wish to seek such financial advice, please consider carefully whether the product is suitable for you as you alone remain responsible for your trading gains and losses.
EneX SignalEneX is signal that give recommendation signals for entry and exit on spot market. This indicators not suitable for leverage trading in futures market.
EneX signal consider several indicators and has entry and exit rules.
EneX signal is suitable for investors who believe in trend following strategy (disclaimer on).
This script composed by Yohan Naftali for educational purpose only. Reader who will use this signal must do own research.
Indicator and Plot Involved
1. Williams Fractals with default periods = 2
2. William Alligator Indicators with default simple moving average 8, 13, and 21
3. Exponential Moving Averages with default value EMA 50, 100, and 200
4. Relative Strength Index with default overbought level = 80 and oversold level = 20
5. Williams Fractals are joined to create support and resistance line and fill area between support and resistance lines.
Entry signal conditions
1. Entry on Weakness when bullish fractal appear on n/2 period
2. Entry when price break resistance line
All entry condition must above EMA and alligator signal and not in overbought RSI
Exit signal conditions
1. Lowest price is below Exponential Moving Average
2. Lowest price is below William alligator lines
You can easily find entry and exit points by using Entry (E), Exit(X) signals
How to use
1. Monitor chart and wait until E or X signals
2. Entry if Entry Signal (E) appear (green colored label)
3. Exit if Exit Signal (X) appear (red colored label)
4. Change indicators setting when necessary
Best Practice
1. Entry only when entry signal (E) appear
2. Never entry when price below William alligator signal
3. Exit when exit signal (X) appear
4. Not exit when exit signal appear when you believe or you have information that price will be rebound
5. Exit if you believe that current price meet your target price
6. Always wise when use EneX signals
Disclaimer
Do your own research and consider fundamental price of asset.
The indicators provided on this script is for educational purposes only.
Author does not offer advisory or brokerage services, nor does it recommend or advise users to buy or sell particular stocks or securities.
Please examined script and give feedback for further improvement.

Inverse Fisher Transform on Williams %RInverse Fisher Transform On Williams %R
Since Williams R indicator produces negative values, I preferred to add 50 instead of subtracting 50.
It produces values between 0.5 and -0.5.
Generates clear buy and sell signals.
Williams %R determines overbought and oversold levels.
You can see more softly.

Alma Moving Average Ribbon Reverse Length [DM]Greetings Colleagues
Following some recommendations and ideas I share this moving average, put all of them together
The length calculation is automatic there is only one input.
The length is inverse so it will wrap from the longest reference point, hence using phi
Moving averages will wrap around the price.
I've also added gradient color to plots and fill plots
There is an alert selector in case you are interested in a particular crossing, "remember that the order is reversed".
There is an alert visual plotshapes with offset signal.
Finally, after spending a few hours with the Williams alligator moving averages I found nothing special, but I added the individual offset adjustment for each moving average in case someone comes up with something.
Enjoy”
Some references about alma by "tradingview pinecoders"
What to look for
The Arnaud Legoux Moving Average has three elements to it:
Window: This element is the period. By default, the window is set to 9 periods, but it can be customized to fit any trading style.
Offset: This element is the Gaussian that is applied to the combo line and can be aligned to the current price. It’s default is set to 0.85, but by setting it to 1, you can make it align fully to the current price (similar to how an Exponential Moving Average (EMA) with a setting of 0 is like a Simple Moving Average (SMA)). 0.85 is what is recommended, however, you can customize it like with the window element.
Sigma: This element is a standard deviation that is applied to the combo line in order for it to appear more sharp. The default is set to 6 and it is not recommended to change the setting. The value of 6 is inspired by the Six Sigma process.
www.tradingview.com
ToTitans - AJ Jim : Type 2 Plus + Alligator (Future & Intraday) What is it ?
It is a strategy based on Type 2 from AJ Jim Class. It used a volume indicator at the same time as William Alligator given a magnificent result. With a bit of knowledge in his class for hedging, it will make your trade perfect.
Must use with 3 indicators 1) ToTitans - TVI , 2) ToTitans - Buy/Sell HHV and 3) ToTitans - Williams Alligator with Life Line. However this strategy already include Williams Alligator with Life Line.
Has no need to add those 3 indicators to use this strategy. Those 3 indicators are included in the signal already. However, the additional indicators are only for visualisation purpose
This strategy aims for giving the user to get a bear and bull icon signal for considering long and short from those combined indicators. However, its performance required a hedging and money management for drastically improve on WinRate and Profit.
This version is optimised for Future and Intraday Timeframe
How to Use it ?
You can use either TVI or Buy/Sell HHV to determine the trend of the trade. Especially the when Buy/Sell Volume is hit the HHV and TVI hit the HHV or LLV as dotted in the those indicators
Using Life Line while enter the cloud as an entry signal
Using Life Line while exit the cloud as an exit signal
Apply Money management for a better performance
Also you can set alert to your phone for Long and Short Entry Signal
Differentiation
The calculation formula has been improved for a better performance
Suitable for
Intra Day Trading (20m-2h). Best for 30m
TFEX:S501!

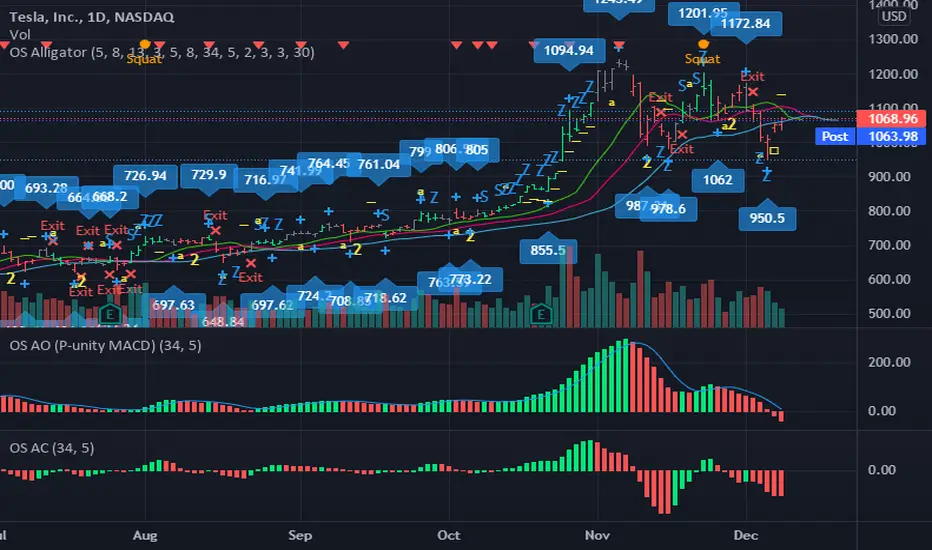
OS AlligatorOS Alligator includes Bill and Justine Williams´ indicators explained both in their "New Trading Dimensions" and "Trading Chaos: Second Edition" books. This script replicates the visual alerts shown on their graphs.
OS Alligator includes:
- Fractals (with labels for easy reading)
- Divergent Bars (signaled by top and bottom triangles)
- Zone bar colors (the bar is green when both AO and AC are green, red when both are red, and black when different)
- Zone buys and sells (subsequent AO of the same color), with letter Z
- Saucer buys and sells, with letter S
- Highest High and Lowest Low tracking (for traling stop setting)
- Balance line (Teeth) crossover alerts
and of course the Alligator's Mouth (Lips, Teeth, Jaw) with SMMA.
All these functions are customizable both in periods and in color. For example if you want to modify the Fractal or HiLo periods you can do so.
You can also add alerts based on any or all indicators.
Thank you for reading. Any comments for improvement are welcome.
-ownsov
Ultimate Buy/Sell IndicatorAn Indicator based on the William Alligator, helping to find suitable entry and exit points.

ToTitans - Williams Alligator with Life LineWhat Is It?
Legendary trader Bill Williams, an early pioneer of market psychology, developed the trend-following Alligator indicator, which follows the premise that financial markets and individual securities trend just 15% to 30% of the time while grinding through sideways ranges the other 70% to 85% of the time. Williams believed that individuals and institutions tend to collect most of their profits during strongly trending periods. You also can find more detail here www.investopedia.com
Differentiation
Add Fill the line as a cloud for easier chart interpretation / trend interpretation
Add EMA 5 (Life Line) for using with Going through the cloud and Exiting from the cloud
This indicator has been used in AJ Jim class for "Type 2" approach
Suitable for
Intra Day Trading (20m-2h)
TFEX:S501!
"PM me to obtain access"

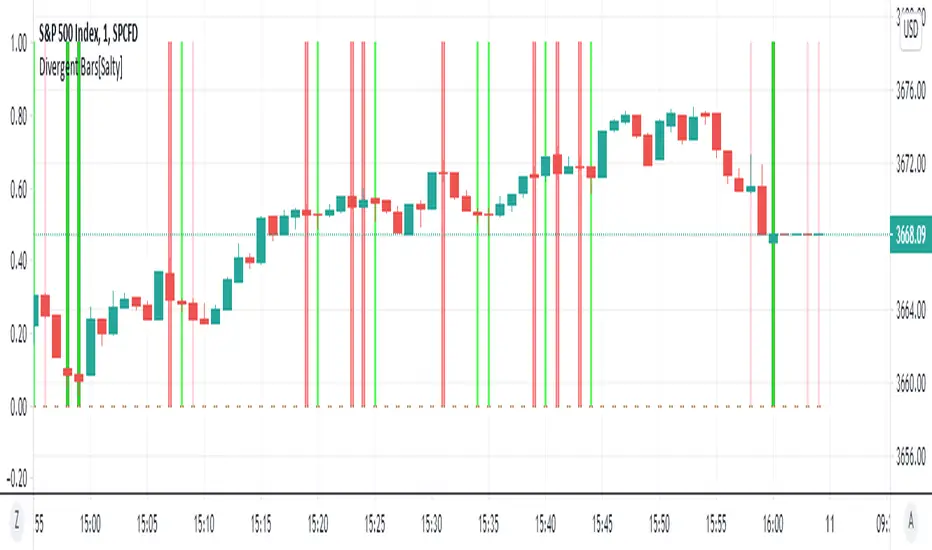
Divergent Bars[Salty]Updated an existing Divergent Bar script to be able to show all divergent bars. There are 2 set of divergent bars that can be turned on. The original one based on price and alligator lines, and a new second one that shows ALL divergent bars. The second set has lighter lines and colors to differentiate them from the filtered alligator divergent bars.
Multi StrategyDuring the course of a trade, we can find ourselves changing strategies depending on the market. Instead of using many different templates, I have a simple indicator that clearly says "Buy", "Sell" or "Stay Out". The great thing about this approach, is we instantly observe the majority are in agreement and that decides which way to place our trade.
This indicator includes the following strategies:
- QQE
- Ichimoku using much faster settings.
- Parabolic SAR
- Supertrend
- TTM Oscillator
- The Squeeze strategy
- The Alligator Strategy
Using this indicator is simple, if the lines are mainly green then buy, if mainly red then sell OR don't trade. So...
Green Line - This strategy is in a buy position
Orange or Black Line - This strategy is undecided
Red Line - This strategy is in a sell position
There are also some green and red circles for reference that appear showing when that bar has broken through the Ichimoku cloud.
The trader's approach is simple, when all indicators are green or red, then take the trade. As soon as one indicator changes, then re-evaluate using your normal process, such as price action, to determine whether to close the trade or continue.
I can customise this further or add other strategies, please message me.

FX Social Entry FinderThis can be applied to Forex, Stocks and Crypto.
Understanding it
When the buy or sell signal align with the wave, it means the price is heading in the direction of alignment.
This indicator is intended to be used as a confirmation indicator for other algorithms for best result.
Indicators with specifically tested and chosen settings that have shown to work on a number of timeframes.
How to use on a buy
When you receive a buy signal if it's within the wave or above the wave, its an indication the market about to continue that direction. You could aim for 20-50 pips depending on the pair.
When to sell
When you receive a sell signal if it's within the wave or below the wave, its an indication the market about to continue that direction. You could aim for 20-50 pips depending on the pair.
When to exit
You can set our indicator to alert you when its a good time to exit the trade.
How to Access
Gain access to FX Social Entry Finder for your TradingView account by being a active member of FX Social.

Fibonacci RainbowThis indicator is inspired by Bill William's Alligator .
Taken 7 Fibonacci numbers, painted in the colors of the rainbow and highlighted when the rainbow fan is up or down.

Zenith BladeThis script is based heavily on "Support/Resistance Zones x3" by Lij_MC
What I did is went and added alerts for when price breakouts the support line/zone.
You have the options to change if it is based on a zone breakout or a line breakout
You also can choose when it will go off, so for example you want an alert to trigger only between 7am and 8am then you can change that in the menu.
Lastly you can choose whither or not to show the Williams Alligator on the chart as I have found it beneficial in conjunction with the script since its based primarily on fractals to calculate Support and Resistance.

CryptoEarnings Alligator EMAIt is very useful indicator to predict the market trend very fast. It works in all time frame but it is more useful in short time frame like 3 Min, 5 Min, 15 Min for intraday traders

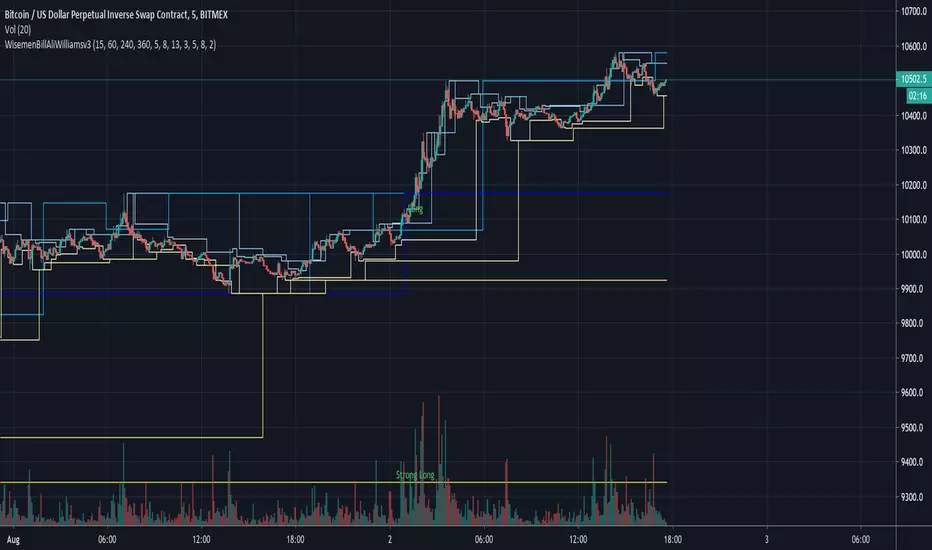
Wisemen Bill Ali Williams v3Use 2 timeframe:
Current timeframe + configurable timeframe (default: 6hours)
Get resistance & support for both timeframe.
Entry when breakout both resistance or both support
For donations
BTC: 3E7rUPX7upS8iTj42JdLt7keJVbJLfvMoH
ETH: 0x094ed88e4c5a9b225e936586cbc2d61f4a027f68
Thank you & happy trading!
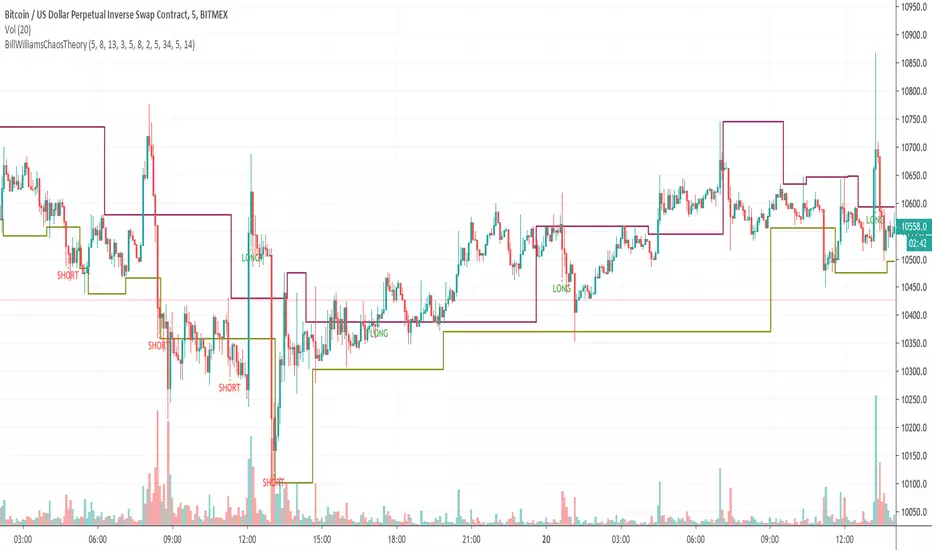
Bill Williams Chaos TheoryBill Williams Chaos Theory
- Alligator
- Fractals
- Accelerator Decelerator Oscillator
- Market Facilitation Index
Combining all of that to generate signal long or short.
Long entry when long signal appears.
Short entry when short signal appears.
For donations
BTC: 3E7rUPX7upS8iTj42JdLt7keJVbJLfvMoH
ETH: 0x094ed88e4c5a9b225e936586cbc2d61f4a027f68
Thank you & happy trading!

420_MA_3 (3 moving average + custom ma + alerts) Three Moving Average System with Alerts
Saw a friend post a 3 ma script recently and I don't think it had this much functionality.
much love
gl hf
xoxo
snoop
