The Moon█ OVERVIEW
The Moon is a script that is designed to help Traders analyse their charts using the moon. This script consists of three main features :
1. Moon Phases Pro : This is a more powerful version of the default built-in Moon Phases where it would plot both past cycles and Future cycles with a better accuracy.
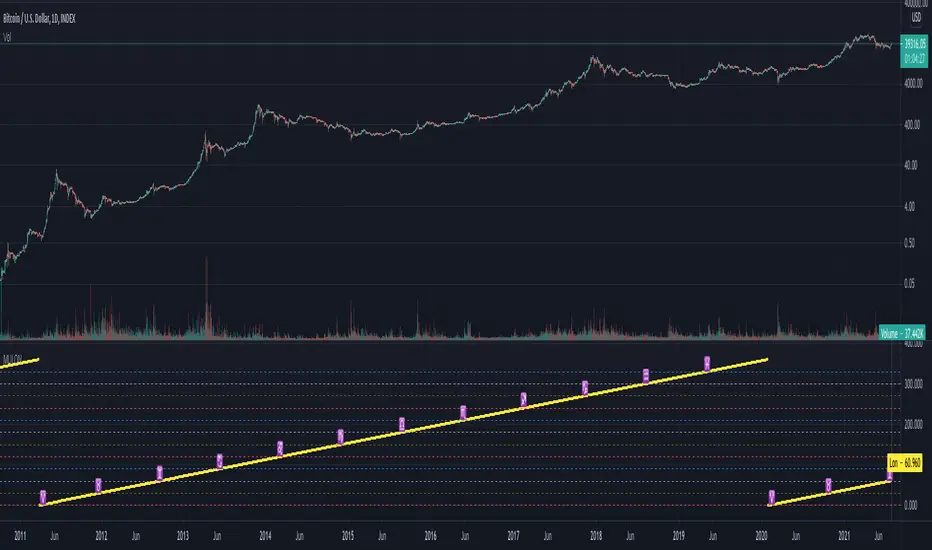
2. Moon Lines : This plots the moon's longitude into price. you can also select your desired $/degree ( price vs time unit) to make these lines better suited for your chart and the asset your playing with. We also didn't forget to add an option to enable harmonics of these lines. In addition, you can select "reverse" to get the downtrending plants as well.
3. Moon Angles : This allows you to highlight areas where the moon is at X degree. you can get the Moon at zero aris or 180 degrees or any other degree!.
We also added some styling options to help with the visuals.
█ Future Plans and upgrades to this script may include :
1. Enhanced algorithm for a faster loading/processing script.
2. More future dates plotting.
And more! Feel free to contact me with any feature that you would like to see in this script
█ How to use :
1. Open the settings.
2. Enable your desired tool and adjust the settings.
Give the script a few seconds and you should be set. Don't enable more than 2 tools at the same time, but if you want to do that, you can insert the same script twice or more in your chart.
This script is coded as an addon to the Gann ToolBox package/scripts.
Astro

Financial Astrology Mean Lilith (Black Moon) LongitudeMean Lilith (Black Moon) represents the apogee of the lunar orbit (point where the Moon is farthest from Earth) as the Moon experience perturbations due to the gravitational pull of the Sun and don't orbit in elliptical path due the fact that don't follow the Earth center but the Earth-Moon Barycenter cause that an average projection of this apogee point location needs to be calculated, for this reason, we need to differentiate the Mean Lilith and True Lilith. The move of this apogee point toward all the Zodiac signs takes around 9 years to complete so in BTCUSD asset we only have one complete revolution so is difficult to emit any clear judgement of the zodiac sign location influence in the trend. However this imaginary body named Lilith is widely adopted by astrologers and is very important in Chinese Astrology, for this reason, we decided to contribute the indicator to support the research of Chinese astro-traders.
Note: The Mean Lilith (Black Moon) longitude indicator is based on an ephemeris array that covers years 2010 to 2030, prior or after this years the data is not available, this daily ephemeris are based on UTC time so in order to align properly with the price bars times you should set UTC as your chart timezone.
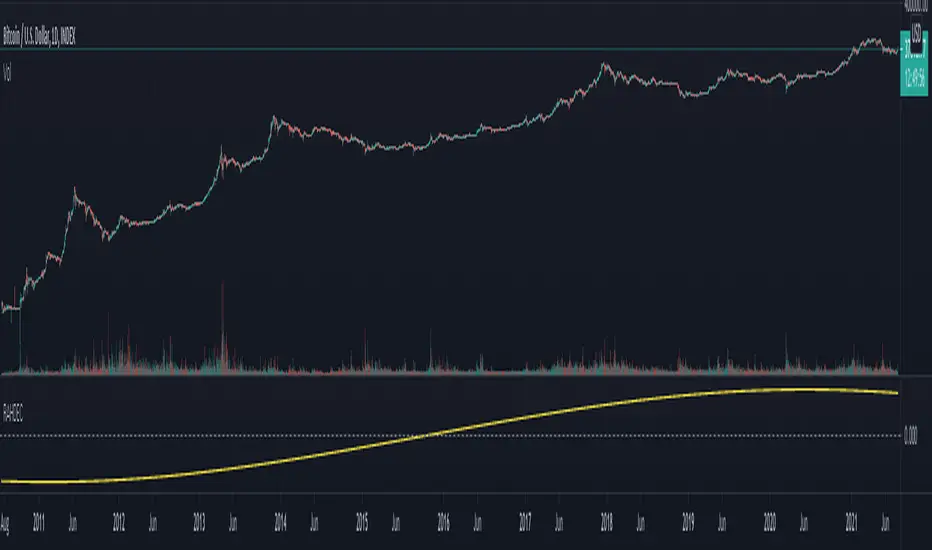
Financial Astrology South Node (Ketu) DeclinationThe declination of South Node (Ketu) is the inverse of North Node (Rahu), therefore, the only relevant pattern that we detected is that when declination was within -6 to +6 degrees the price was congested within narrow price zone as was previously mentioned at the North Node (Rahu) declination indicator.
Note: The South Node (Ketu) declination indicator is based on an ephemeris array that covers years 2010 to 2030, prior or after this years the data is not available, this daily ephemeris are based on UTC time so in order to align properly with the price bars times you should set UTC as your chart timezone.

Financial Astrology North Node (Rahu) DeclinationThe North Node (Rahu) declination is a long term cycle so don't seem to provide useful pattern for short/mid term trading, however is interesting to note that when the declination was within -6 to +6 degrees the price was congested within narrow price zone. As observed in all planets declinations indicators the boundary of moving from North to South or viceversa is critical to determine trend change but in the case of the Moon Nodes it seems to show that the planets energy becomes in equilibrium which causes that price are more stable.
Note: The North Node (Rahu) declination indicator is based on an ephemeris array that covers years 2010 to 2030, prior or after this years the data is not available, this daily ephemeris are based on UTC time so in order to align properly with the price bars times you should set UTC as your chart timezone.
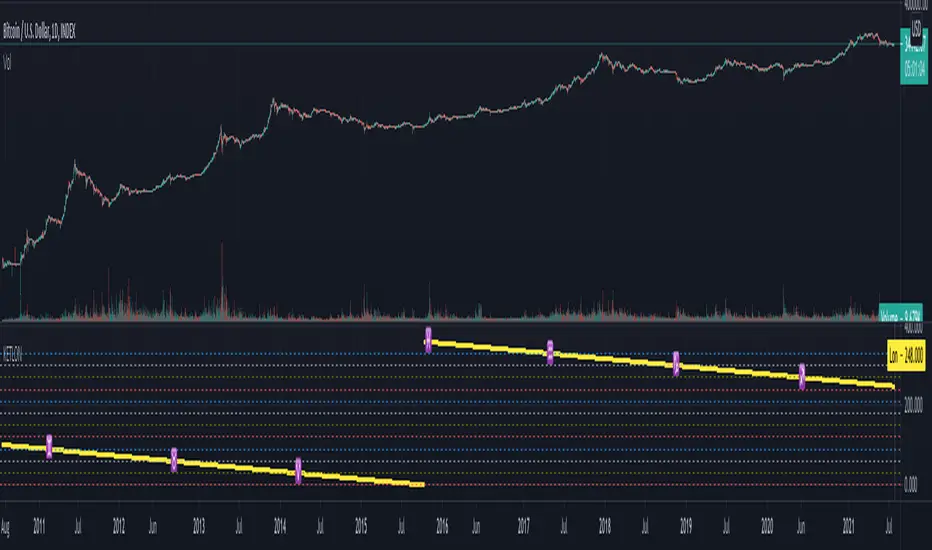
Financial Astrology South Node (Ketu) LongitudeSouth Node (Ketu) in Vedic astrology is considered to cause a bear trend when Eclipse occurs at this Moon Node. Moon Nodes are important because when Moon and Sun are in conjunction or opposition very close to the degree of a Moon's Node, a Solar or Lunar eclipse occurs.
The effect of the trend will be coloured by the Moon Node zodiac sign position. Based on statistical research we have noted that the periods where South Node (Ketu) was located in Sagittarius the trend was bullish 56% of the days, in Aquarius 54% of the days and in Pisces 62% of the days. When located at Aries was bearish 51% of the days. The other zodiac signs experienced mixed results that don't show a clear pattern.
Consider that the transition of South Node across all the Zodiac signs takes 19 years so in all BTCUSD historical prices, we don't have a complete revolution yet, for this reason, our understanding of all the energy frequencies related to South Node location are incomplete.
Note: The South Node (Ketu) longitude indicator is based on an ephemeris array that covers years 2010 to 2030, prior or after this years the data is not available, this daily ephemeris are based on UTC time so in order to align properly with the price bars times you should set UTC as your chart timezone.
Financial Astrology North Node (Rahu) LongitudeThe Moon Nodes are the points where Moon crosses the ecliptic and transition from North to South latitude, North Node (Rahu) in Vedic astrology is considered to cause a bull trend when Eclipse occurs at this Moon node. Moon nodes are important because when Moon and Sun are in conjunction or opposition close very close to the degree of a Moon Node, then a Solar or Lunar eclipse occurs.
The effect of the trend will be coloured by the Zodiac sign where the Moon Node is located at, based on statistical research we have noted that the periods where North Node (Rahu) was located in Geminis the 56% of days was bullish, in Virgo 62% of the days was bullish. The most bearish location was Libra with 51% of days bearish. However the transition of North Node around all the Zodiac takes 19 years so in all BTCUSD price history we don't have yet a complete revolution to have a complete understanding of all the energy frequencies.
Note: The North Node (Rahu) longitude indicator is based on an ephemeris array that covers years 2010 to 2030, prior or after this years the data is not available, this daily ephemeris are based on UTC time so in order to align properly with the price bars times you should set UTC as your chart timezone.

Financial Astrology Ceres LongitudeCeres is the largest object in the asteroid belt between Mars and Jupiter orbits, most of the people don't know that Ceres don't have the category of asteroid but a "dwarf planet", the same as Pluto. Many astrologers don't take Ceres into account when casting an astrological chart but my thinking is that if is proved by experience that Pluto with a mass of 1.30900 x 10^22 kilograms is relevant for market predictions, why not to consider Ceres which has a mass of 9.39 x 10^20 kilograms (7.2% of Pluto mass) but is closer to the Earth?
Through the statistical analysis of Ceres transit through tropical zodiac signs we noted that for BTCUSD there was a significant bullish trend where Ceres transited Aries (62% days), Gemini (67% days), Virgo (57% days) and Pisces (62% days) and significant bearish trend where Ceres transited Libra (56% days) and Scorpio (61% days).
The astrologer Bill Meridian indicated that Ceres rules: food and nursing homes. Other astrologers suggest that it rules: cooking, eating, farming, growing, gardening. I think we need more research to identify the specific sectors that are ruled by Ceres but definitely this dwarf planet is very relevant for financial markets trend forecasting.
Note: The Ceres longitude indicator is based on an ephemeris array that covers years 2010 to 2030, prior or after this years the data is not available, this daily ephemeris are based on UTC time so in order to align properly with the price bars times you should set UTC as your chart timezone.

Financial Astrology Pluto DeclinationPluto moves very slow in declination as can be viewed in this indicator, therefore, is logical to think that looking Pluto declination for short or mid term trading is useless. We cannot determine any useful pattern from Pluto declination or longitude but we was willing to document here that we did the exploratory analysis of all planets declination. The conclusion is that what is relevant for trading are the declinations of the tradition astrology planets: Moon, Mercury, Venus, Sun, Mars, Jupiter and Saturn. However, Pluto speed phases seems to be relevant so we recommend to keep an eye on the Pluto speed indicator.
Note: The Pluto declination indicator is based on an ephemeris array that covers years 2010 to 2030, prior or after this years the declination is not available, this daily ephemeris are based on UTC time so in order to align properly with the price bars times you should set UTC as your chart timezone.
Financial Astrology Pluto LongitudePluto energy manifest as destruction, rebirth, death, waste, obsession, extremism, transformation, crime and underworld or unconscious. It takes in average 21 years to transit each zodiac sign so in relation to financial astrology, Pluto in Capricorn (current location) represent a generation that tends to be extremist and obsessed in materialism. This position also represent the evolution and transformation of some emergent economies that are raising the hand as the successors of the world power and the destruction of old professions with the rebirth of digital oriented jobs driven by technology (blockchain, artificial intelligence an internet). As Pluto travel towards Aquarius, this technology oriented transformation will reach the maximum momentum with a very intense technological disruption of the old tools we are accustomed to use today in favor of more powerful inventions that can take humanity toward the next level of evolution. Very likely this will be the massive adoption and popularisation of quantum computing, alternative energy sources and touristic space travels.
This indicator is not useful for short/mid term trends but as Pluto transit into different zodiac signs this will mark relevant disruptions in the humanity leadership organisation.
Note: The Pluto longitude indicator is based on an ephemeris array that covers years 2010 to 2030, prior or after this years the data is not available, this daily ephemeris are based on UTC time so in order to align properly with the price bars times you should set UTC as your chart timezone.
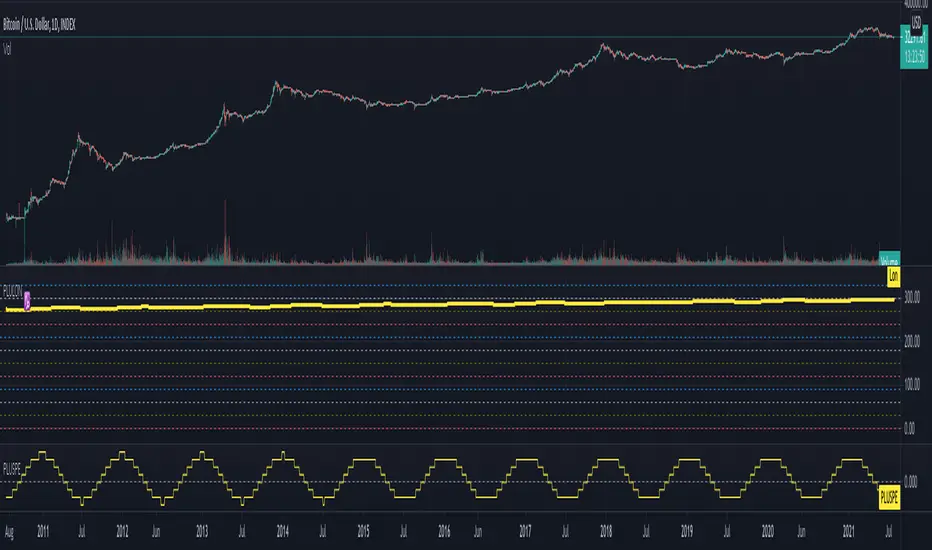
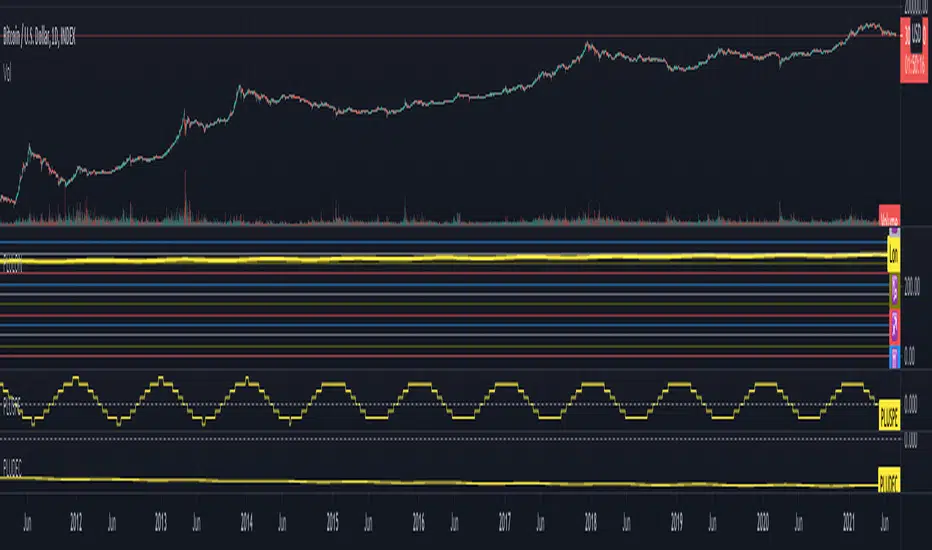
Financial Astrology Mercury SpeedMercury speed phases (stationary and retrograde) was closely observed by W. D. Gann in order to determine potential trend changes, in BTCUSD we can see some turning points close to the speed dips (when Mercury speed cross the zero line). However, what looks more interesting is that when the Mercury speed is accelerating the price range of the candles is larger, is the same pattern that we noted with the Moon speed indicator so we can conclude that speed acceleration periods produce more intense effects when Mercury aspects occurs.
Note: The Mercury speed indicator is based on an ephemeris array that covers years 2010 to 2030, prior or after this years the speed is not available, this daily ephemeris are based on UTC time so in order to align properly with the price bars times you should set UTC as your chart timezone.

Financial Astrology Mars LongitudeMars energy control the initial impulse, the courage to execute a risky action or to start a new entrepreneurship, to declare the war and fight. It allow us to focus our energy into impulsive action that will require a lot of our forces to produce the initial movement and momentum. Mars drives and directs our motivation into quick and impulsive actions. This planet also rules the angry, fight, conflict, wars and explosive reactions. Therefore, from trading perspective, Mars rules all the industries that imply a higher risks: sports, military, defence, startups (new entrepreneurship), high volatility industries and so forth. Aries zodiac sigh, the domicile of Mars is the archetype of the persons that are willing to move quick from the idea into the action, that are looking to explore new territories and take high risks.
With the manifestation of this impulsive and initiating energy through the zodiac signs we can predict the level of risk that the traders influenced by Mars and dominated by fire will take. This individuals, will desire higher risks when Mars is located in a zodiac sign that strengthens the fire force. Is not a surprise that BTCUSD is more bullish when Mars transits Aries, Gemini (air strength fire) and Sagittarius and bearish when transits Leo (this energy becomes more oriented to pleasures, parties, romance, passions), Virgo (challenge the impulse with the analytic thinking), Aquarius (boring of the existing holding needs to move into another stuff and is desiring a change), Pisces (period of reflexion and mediation of the results of the impulsive cycle that completes).
The most relevant Mars bullish zodiac signs positions for BTCUSD are: Aries 62% days, Gemini 66% days, Sagittarius 58%. The all history buy/sell frequency distribution is 55% (bull) 45% (sell) so BTCUSD has bias to the bullish side, even considering that, the bull frequency on this signs seems to be very relevant and can be analysed with this indicator in the BTCUSD TradingView index that provide historical price since 2010.
With this indicator there is unlimited possibilities to explore the impulsive risk prone actions across different markets to study how this plays out, no more manual chart annotations to identify the zodiac sign location of Mars. We encourage you to analyse this zodiac sign cycles in different markets and share with us your observations, leave us a comment with your research outcomes. Happy research!
Note: The Mars tropical longitude indicator is based on an ephemeris array that covers years 2010 to 2030, prior or after this years the longitude is not available, this daily ephemeris are based on UTC time so in order to align properly with the price bars times you should set UTC as your chart reference timezone.
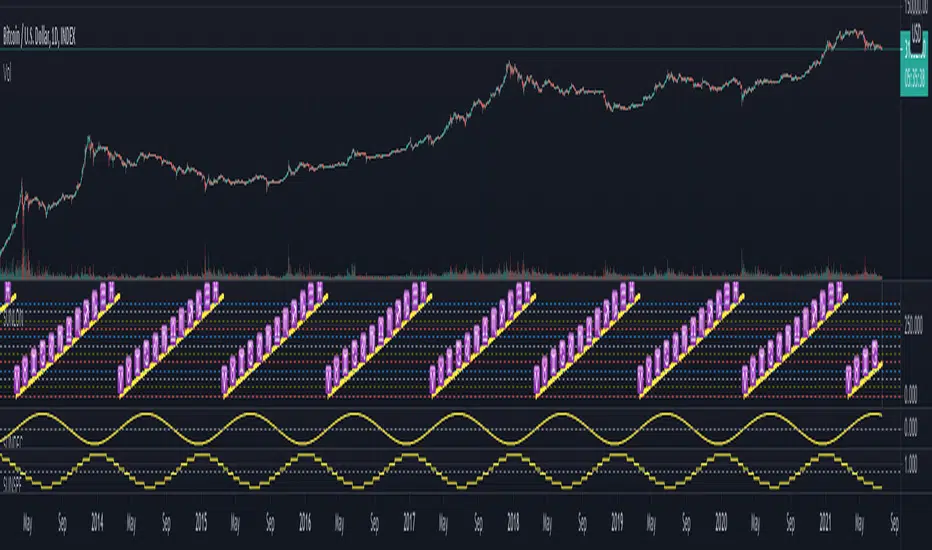
Financial Astrology Venus LongitudeVenus energy influence the affections, beauty, passion, arts, festivities, finance, marriage, speculation. As a traders the Venus cycle will determine the affection, love and interest we manifest for specific industries that we perceive more fascinating and seductive for our speculation purposes. Financial astrologer Bill Meridian suggest that Venus rules the industries of "recreation, cosmetics, fashion, leisure".
Personally I believe that the affection to hold shares within specific industries will be determined by the zodiac sign position of Venus. For example, Venus in Aries will rule sports, war industry, high risk and volatility, in Taurus the land, agriculture, cattle raising, banks, exchanges and and desire for stability, in Gemini the mass media, newspapers, marketing, publishing house, conferences and desire to discuss the trending topics, in Cancer the real state, bars and restaurants, fishing and so forth with the standard zodiac sign industries rulership. Therefore, traders will feel more affection for the industries / emotional behavior ruled by the sign that Venus is transiting. Therefore, as Venus transition to other signs that are incompatible with an industry characteristics, that desire to hold shares in a given industry would diminish.
Within the financial astrology research we have identified that the BTCUSD bullish Venus zodiac signs are: Aries, Gemini, Leo, Virgo, Scorpio, Aquarius and Pisces. The bearish signs are: Taurus, Cancer, Libra and Capricorn. The other signs show mixed results. As expected, Aquarius was a prominent position due to the fact that represent "technology and innovation", Pisces seem very relevant because represent the destruction of the previous model, the end of the traditional banks financial system in favor of the decentralized finances (DeFI) approach. Aries, because is the entrepreneurship spirit of the new opportunities that arise with this financial system transition where masses are willing to start trying, exploring and taking risks (adventures) in this alternative way to manage and storing your assets. Leo because cryptocurrencies is the new tech fashion and hot speculation area. Virgo because it provide a perfect immutable decentralised database (the blockchain) that couldn't be altered or manipulated so is precise and exact financial system that correlate well with the precision and exactness affection we feel within Virgo influence.
With this indicator there is unlimited possibilities to explore across different markets to strudy how the Venus energy influence plays out, no more manual chart annotations to identify the zodiac sign location of Venus. We encourage you to analyze this zodiac sign cycles in different markets and share with us your observations, leave us a comment with your research outcomes. Happy research!
Note: The Venus tropical longitude indicator is based on an ephemeris array that covers years 2010 to 2030, prior or after this years the longitude is not available, this daily ephemeris are based on UTC time so in order to align properly with the price bars times you should set UTC as your chart reference timezone.

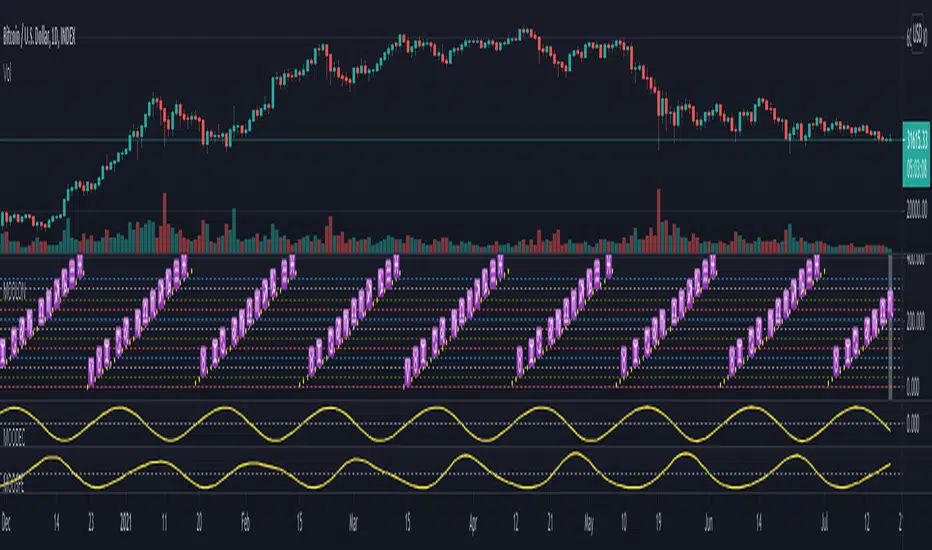
Financial Astrology Moon LongitudeMoon energy represent the masses, crowds, public places, children and emotions. The transit of the Moon through the zodiacal signs will color the crowd emotional responses that fluctuate based on the elemental qualities of the signs: fire (energetic and impulsive), earth (rigid, static, patient), water (assimilation, transformation, humor fluctuations), air (expansion, fervent, germination).
The daily average speed of the Moon is 13 degrees, for this reason the emotional elemental energy is transforming in average every 2 days and few hours, this mood fluctuations produces the short term instinctive and emotional actions performed by traders that forget the precise mathematical / statistical approach in favor of irrational and emotional impulses.
Based on statistical buy/sell frequency analysis we discovered that for BTC-USD, the Moon is usually bullish in zodiac signs: Aries, Libra, Scorpio, Aquarius and Pisces, the most relevant bullish sign is "Aquarius", from 206 observations in all the BTC-USD price history where Moon was in this sign the 60% of those days the price increased compared to the previous day. The bearish zodiac signs for BTC-USD are: Taurus, Cancer, Leo, Sagittarius and Capricorn, the most relevant bearish sign is "Capricorn".
Interestingly this zodiac sign locations tends to fluctuate during some periods of time and from the last 10 observations of the Moon transiting through Aries we noted that 7 of the 10 observations coincide with a dip, sometimes the Moon in Aries indicate the reversal of the short term trend, this is kind of expected considering that when Moon approaches Taurus the fall becomes more likely due to the fact that Moon in Taurus is a bearish signal.
With this indicator there is unlimited possibilities to explore across different markets and complementing with Moon phases this may be the perfect financial astrology indicator for those intraday traders that keep positions only for few hours.
We encourage you to analyze the Moon zodiac sign cycles in different markets and share with us your observations, leave us a comment with your research outcomes. Happy trading!
Note: The Moon longitude indicator is based on an ephemeris array that covers years 2010 to 2030, prior or after this years the longitude is not available, this daily ephemeris are based on UTC time so in order to align properly with the price bars times you should set UTC as your chart reference timezone.
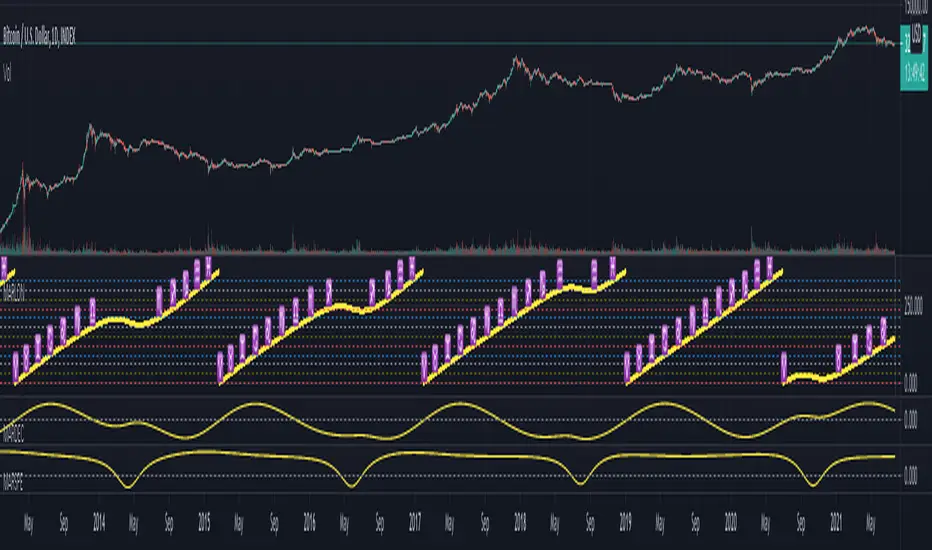
Financial Astrology Mercury LongitudeMercury energy influence the mind, the intellect and mental temperament, in mundane astrology is well know that rules: news, science, debating, trading, commerce, contracts. telecommunication, short-distance travels, among others. W. D. Gann discovered that the Mercury speed phases (stationary, retrograde, direct) transitions was very relevant as trading signals, he used the Sun conjunction retrograde Mercury to confirm the formation of top and bottoms that seems to be a relevant leading indicator in multiples markets.
As part of the Financial Astrology Research Group experiments, we created hundreds of machine learning models that try to predict daily trend direction for a research portfolio of 10 crypto-currencies and is confirmed that including the Mercury speed and aspects features (variables) in the models increase the accuracy in a consistent manner. Therefore, there is enough evidence that Mercury is one of the most powerful mid term trading cycles.
This is the first open source PIneScript indicator that is able to plot the Mercury Tropical Longitude for the years 2010-2030, we publish as open source in order to support and simplify the research of the amazing astro-traders community at TradingView that have been working manually with annotations and lines to represent the Mercury longitude zodiac signs entries and the speed phases transitions. That manual work is over. Let's move faster in our cycles research!
We encourage all astro traders to continue researching and sharing your ideas of astro cycles trading strategies with us and contribute your experiments at our Github Financial Stats exploration project
so we can improve the cosmic energy models that influence traders behaviours.
Note: The Mercury longitude is based on an ephemeris array that covers years 2010 to 2030, prior or after this years the longitude is not available, this daily ephemeris are based on UTC time so in order to align properly with the price bars times you should set UTC as your chart reference timezone.
Others astro trading indicators from Financial Astrology Research Group:

Financial Astrology Sun LongitudeFinancial astrology is a branch of mundane astrology that research the correlations of planet cycles with market prices, this indicator developed by the Financial Astrology Research Group provides the visualization of the Sun Tropical Zodiac Longitude to support that astrology traders can study multiple markets within the powerful Trading View UI to detect potential cyclical patterns in price action that are connected with the cosmic rhythm of the Sun.
The Sun have been very relevant cycle among all ancient civilizations such as Maya, Aztec, Inca, this cyclical move is the fundamental frequency of our life's due to the fact that our calendar year is a model from this cycle. Chinese astrologers and W.D. Gann was aware of the powerful predictive power of the solar terms which is a representation of the most relevant weather transitions within the Sun longitude path.
With this indicator we try to ease the research work of the amazing community of astro-traders that prior to this indicators needed to create hundreds of manual annotations on the markets price charts to visualize the Sun zodiac position within a long period of time in order to research potential cycles. That manual work is over. Let's move faster in our cycles research!
We encourage all traders using astrology to continue their research, please share your ideas of astro cycles trading strategies and contribute your experiments at our Github exploration projects: github.com
Note: The Sun longitude is based on an ephemeris array that covers years 2010 to 2030, prior or after this years the longitude is not available, this daily ephemeris are based on UTC time so in order to align properly with the price bars times you should set UTC as your chart reference timezone.
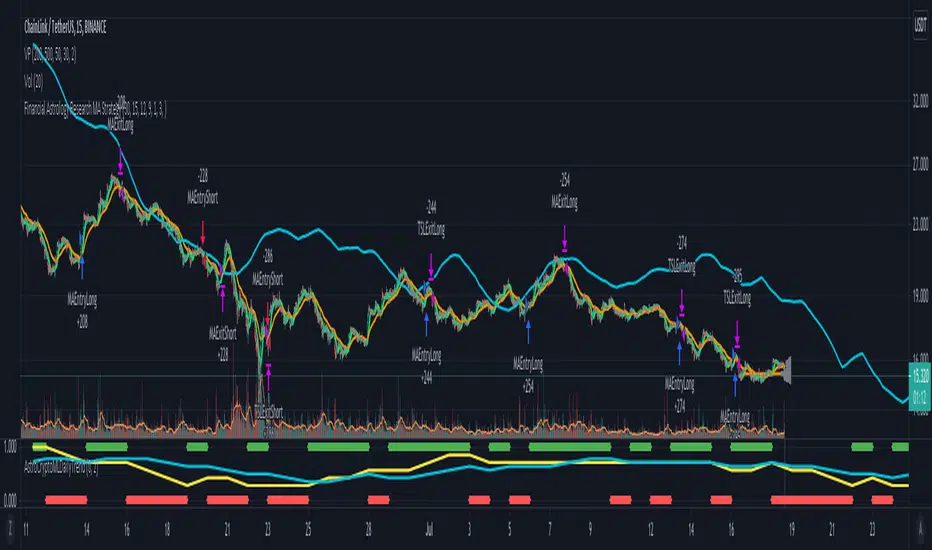
Morun Astro Trend MAs cross StrategyAstrology machine learning cycles indicator signals with technical MAs indicators strategy, based on signals index of Github project github.com
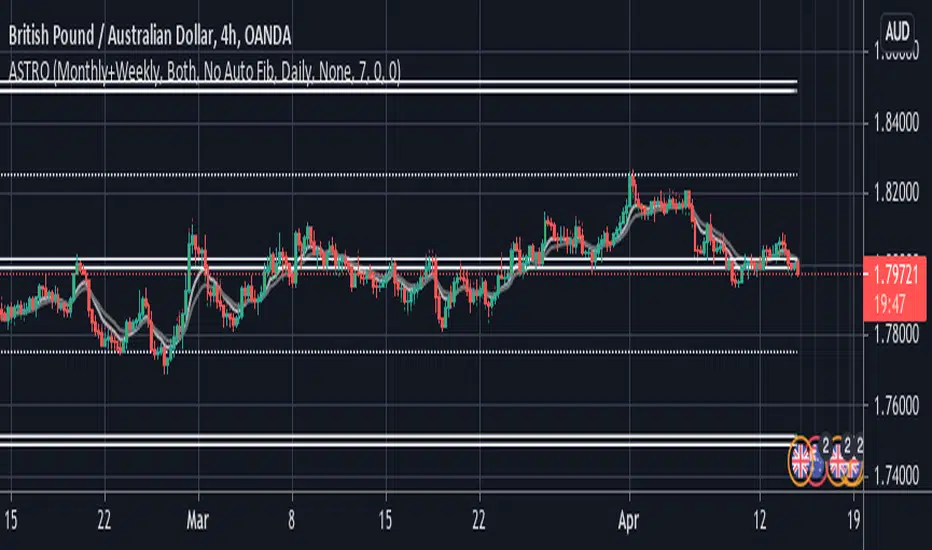
Astro FX indicatorsThis is a suite of commonly used indicators from the Astro FX course. If you are already familiar with all how to use all of these tools it will be useful to have them all in one place. If you are not already familiar with these then there is way too much to cover here in a simple description!
Happy trading!
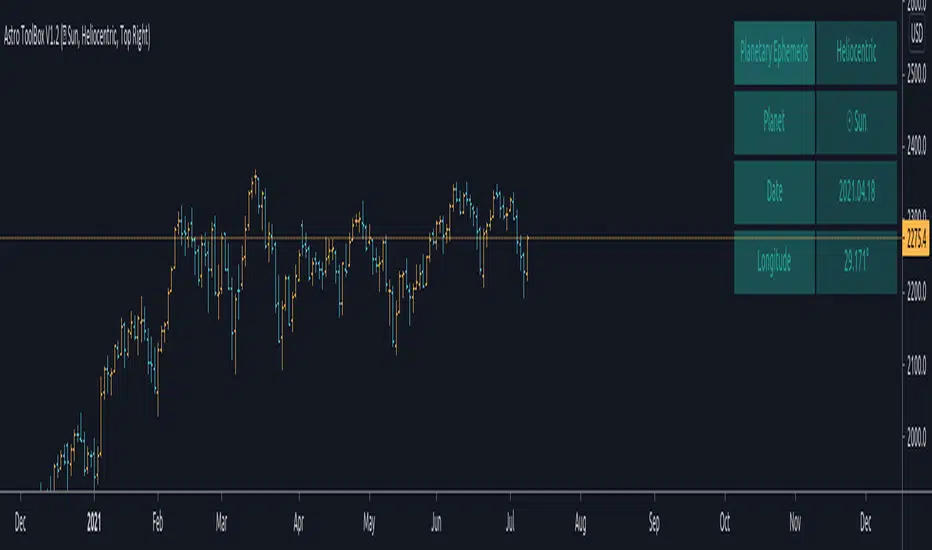
Astro ToolBox V1Astro ToolBox V1 - v1.0
█ OVERVIEW
The Astro ToolBox is meant to be a complementary script to the Gann ToolBox package. This script aims to offer a data set that was very hard to obtain through TradingView. Mainly Ephemeris Data.
The current first version allows the user to select a date and a planet and gives them the Longitude, and the Latitude of that planet on the date choose.
There are differences when it comes to Heliocentric and Geocentric locations. This script also includes options to select between Heliocentric and Geocentric locations/angles.
This script took a lot of research and fine tuning to get all this data to this great platform. The script does a lot of calculations to obtain this data and come up with it within 1-2 arc seconds of accuracy.
█ Future Plans and upgrades to this script may include :
Planetary Retrograde auto plotting. ( hopefully within the next 2-3 weeks )
Planetary Aspects and Transits. ( next in line after the retrogrades )
Aspects and Transits based on a natal date of your choosing.
and hopefully more, if you have any suggestions please don't hesitate to contact me.
█ How to use :
Simply select the date that you would like to look up.
Then select the planet / cycle.
You will have a chance to choose between a Heliocentric or a geocentric ecliptic view.
Once you select what you need, you will find your data in the lower right-hand side of the screen.
It is always recommended to keep your chart set to "EXCHANGE TIME" rather than "UTC or any other"
and hopefully more, if you have any suggestions please don't hesitate to contact me.
█ Things to keep in mind :
1. The moon is only Geocentric.
2. No this data does not rely on an external API coming from a space agency or any observatory but it is all calculated through a series of formulas and calculation which is why it is always good enough but not a %100 accurate. I personally find it extremely useful for Trading if one is familiar with time/gann theory.
Gann Toolbox V2// ========================================================================//
This script is meant to help you save a lot of time plotting your Gann Boxes and Cycles correctly and accurately.
This is a recoded version of "Gann ToolBox V1.5/1.7"
This script allows you to scale your boxes and square them with a simple input in the script's settings "$ per degree".
It includes a few default cycles already built into it ( March and September ) and an advance mode that lets you place the box anywhere you want and create your own custom cycle. through any time period you want.
You get the 1:1, 1:2, 2:1 Gann fan angles at each corner of the box and some additional angles at the midpoint to give you a complete star formation.
Using the Advance mode you can also adjust the length of your custom cycle and the global height increments. Default is 360degrees.
You can also play with the offset values for your cycles.
That's not all, you also get to plot your horizontal lines between each cycle at an increment of your choosing.
Using this script you will be able to plot any cycle that you want with a few clicks & and a few seconds.
in the advance more you could extend the advance custom cycle to engulf future price action.
This script work with all the assets correctly and beautifully from Stocks to Crypto-Currencies.
// ========================================================================//
This script comes with "Gann Seasonal Dates, Gann Planets vs Sun, Moon at Zero" as addons if you decide to purchase it.
// ========================================================================//
My contact information are available and listed below.
Enjoy!

Gann Toolbox V1.5Gann ToolBox V1.5
// ========================================================================//
This script is meant to save you a lot of time plotting your Gann Boxes and Cycles correctly and accurately.
It allows you to scale your boxes and square them based on $ per degree.
It includes a few default cycles already built into into and an advance mode that lets you box the box anywhere you want through any time period you want.
You get the 1:1, 1:2, 2:1 Gann fan angles at each corner of the box and some additional angles at the midpoint to give you a complete star formation.
Using the Advance mode you can also adjust the length of your custom cycle and the global height increments. Default is 360degrees.
You can also play with offset values for your cycles.
That's not all, you also get to plot your horizontal lines between each cycle at an increment of your choosing.
Using this script you will be able to plot any cycle you want with a few clicks. And get your planetary lines and cycles quickly.
This script work with all the assets correctly and beautifully
Examples :
// ========================================================================//
This script comes with "Gann Seasonal Dates" as an add-on if you decide to purchase it.
// ========================================================================//
My contact information are available and listed below.
Enjoy!


Chaos 2.0This is pure chaos!
I just wanted 1 thing I can put on a chart to try to get a clearer picture of what is going on (and not take up all the indicator spaces a free user is allowed haha)
Many things going on from so many different users
honestly I'm sorry I cant shout out everyone whose code I have ever read and used in another project just for the sake of learning more about pinescript!
As a way of shouting everyone out! (and giving out my most useful and configurable system)
I give you... CHAOS
I originally got an Alligator, AO, and Fractal script from a user ChaosTrader, then realized I love using averages!
I added the MESA (lazybear?) and the McGinley Dynamic Range (sry idk) and a simple 233 SMA.
I also found about something called the www.prorealcode.com another user had created for Pinescript.
I really liked that script so I adapted it to do the same kind of signal printing for circles and squares (crosses and series)
Check it out tell me what you think and how I can make it better for everyone!
thanks all!
Snoop
