Cryptohopper ATRThe Cryptohopper ATR analyses the volatility of the asset. When the market is rather ranging, the volatility remains low and the ATR line decreases . However, when the market starts moving quickly in one direction, doesn’t matter if it’s up or down, the ATR will start rising.
It can be a very good indicator to spot when the big investors are entering the market to buy or sell.
We have added a moving average of the ATR line to generate signals. In this way, when volume starts flooding the market and the volatility peaks, the ATR line will rise above its moving average. Likewise, when the volatility falls and the market ranges, the ATR line will fall below its moving average.
Last but not least , unlike with other indicators, the ATR does not generate buy or sell signals since it measures the volatility of the market. Therefore, the price can be going up or down.
Then, how can you use this indicator in your automated strategy? It can be described as a volatility filter . When the ATR line goes above the moving average, the market is more volatile and the price is moving, then the ATR will let another indicator(s) to give a buy or sell signal. However, when the volatility is low and the price is ranging, the ATR is below its moving average, and it won’t let another indicator(s) to give any buy or signal.
Therefore, it filters out trades when the market volatility is low and the price doesn’t move much and let your strategy trade when the market is volatile and the price is trending.
--
As you can see in the chart, when the ATR line (orange line) is below the blue line, the price is not volatile and it is likely to be ranging. On the other hand, when the ATR line is above the blue one, the volatility of the market is increasing, which means that the price is initiating a new trade and there will be more trading opportunities.
ATR

[KICK] Volatility HeatmapWith this indicator you can gauge the price volatility of an instrument across multiple timeframes in a very compact visualization. It allows you to find critically low areas of volatility and predict the likelihood of an imminent move or the conclusion of a move. While you can do this with other indicators, it is often easy to miss low volatility on timeframes that you don't normally survey.
Features:
Measure volatility using either Average True Range Percentile Rank (ATR-PR) or Historical Volatility Percentile (HVP)
Measure volatility from any other source (e.g. Volume, or custom series from another indicator) using HVP
2 Rendering Modes (Smooth and Distinct) as seen in the sample chart above
Ability to show current timeframe Volatility in bar chart above the heatmap
Get alerts when a certain number of timeframe levels (configurable) are showing critically low volatility (implying imminent move)
Get an alert when the current timeframe volatility level emerges from a critically low volatility zone (usually indicating the start of a significant move)
The bands on the map are 1x, 2x, 3x, 5x, 8x, 13x, 21x, and 34x the curent timeframe. The volatility measurements go (from lowest to highest): Lime, Blue, Dark Purple -> Light Purple (gradient), Magenta, Pink. If you see grey blocks/bands, these indicate that the instrument you are using does not have enough historical data to determine the volatility based on your timeframe and reference period. For example, if you are using a reference period of 100 and are on the daily view, to render the bottom-most band (x34) you would need around 3400 days of data (over 9 years).
You can use this indicator in multiple ways. My favorite way personally is to look for areas that have multiple consecutive timeframes showing low volatility warnings and then enter when the highest of those timeframes turns back to purple. Use other methods, analysis, or indicators to determine direction (or just straddle P.A. with market stops). If I am scalping, then I will generally mostly watch the "current timeframe" and get alerts when it emerges from low volatility.
Use the link below to watch a tutorial video, request a trial, or purchase for access.

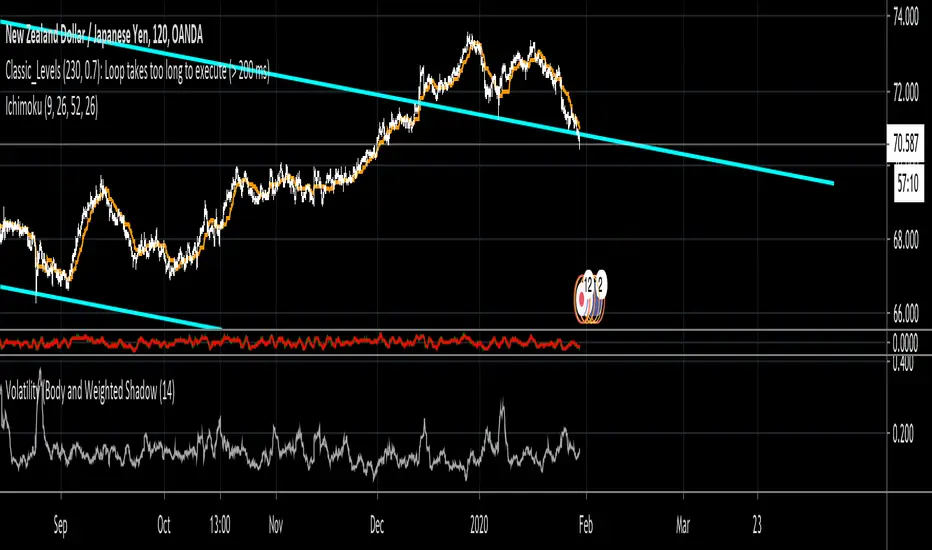
Volatility (Body and Weighted Shadow)- Volatility Indicator
- Replacement for ATR
- As each pair holds a different level of volatility, a stop loss can be set using this indicator rather than via a ratio 2:1, etc. e.g. 2 X Volatility Value = S/L...
- This indicator averages the bodies of candlesticks over a default length of 14 periods. It also considers the length of shadows via a weighted average. This is done as it is assumed that financial institutions tend to move price to levels that do not hold (shadows). Therefore, wick lengths are less significant than the candlestick bodies, so they are weighted to hold less value.
Forex Daily Trading - NNFX StyleHere is my implementation of the No Nonsense Forex way of trading.
I've tried to apply most of VP's rules to the best of my coding abilities. As of now, with default settings, the strategy does not perform exceptionally well - however I'm pretty confident there is a combination of settings that will make it profitable across all pairs, and maybe even commodities.
If anyone can find some good performing settings for this strategy please let me know and I'll provide the full logic and all indicators within the strategy. Also, if you have any suggestions of any indicators you feel could improve this strategy let me know and I'll update.
If anything doesn't make sense/doesn't work, or if you just need some more information please just let me know. Enjoy!

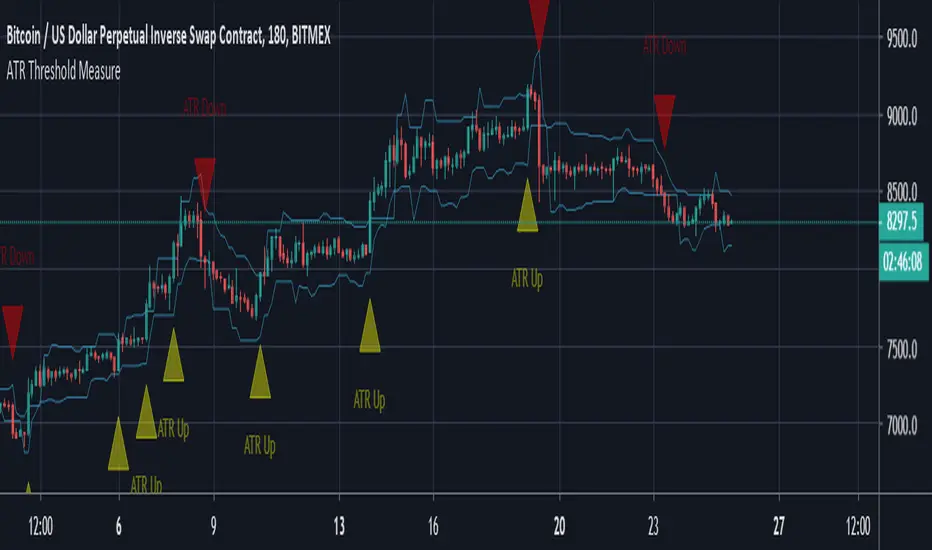
ATR Threshold MeasureATR Threshold Measure in short gives an alert when price closes below or above the ATR threshold lines shown on the chart.
Each plot for upper and lower threshold is based on the difference in price between the open and close of the last consecutive candle sequence then divided by the number of ATRs set by the indicator to verify if price has indeed closed above or below it. Setting alerts to bar candle close only will prevent false alerts mid candles.
A quick bearish example of this would be if you had 4 consecutive red candles. The indicator will take the open of the first candle of the sequence and subtract the current close value from the current candle. It will then take that difference and determine how many ATRs price has moved based on the ATR of the original candle in the sequence(Not the current ATR). If the close of the current candle exceeds the threshold set in the settings an alert is given to notify the user of an increase of volatility in the market in the opposite direction of trend or continuation of trend in a high volatility manner.
ATR x TP & SLSimple script based on ATR to calculate your Take Profit and Stop Loss
Input variables:
ATR Period ( Default: 14 )
TP Multiplier ( Default: 1*ATR )
SL Multiplier ( Default: 1.5*ATR )
SFL ATR BandsMany traders use ATR as a way to determine stop loss placement. It usually works like this:
- Stop loss for a short trade = high of last candle + ATR value
- Stop loss for a long trade = low of last candle – ATR value
This is an indicator that allows you to do just that: it gives you an easy way to view current and historical volatility using ATR-based price bands .
Features
The indicator is configurable with the following settings:
ATR period
ATR multiplier
ATR applied to highs/lows OR the close price
Bands offset
Only show for the last X candles
How To Use This Indicator
Since this indicator shows average volatility bands, it is a good measure of how much the price moves. So we can use ATR bands in a number of ways:
it’s an easy way to see where you can place your stop loss
you can use a multiple of ATR as your trade target
you can trail your stops alongside the ATR bands

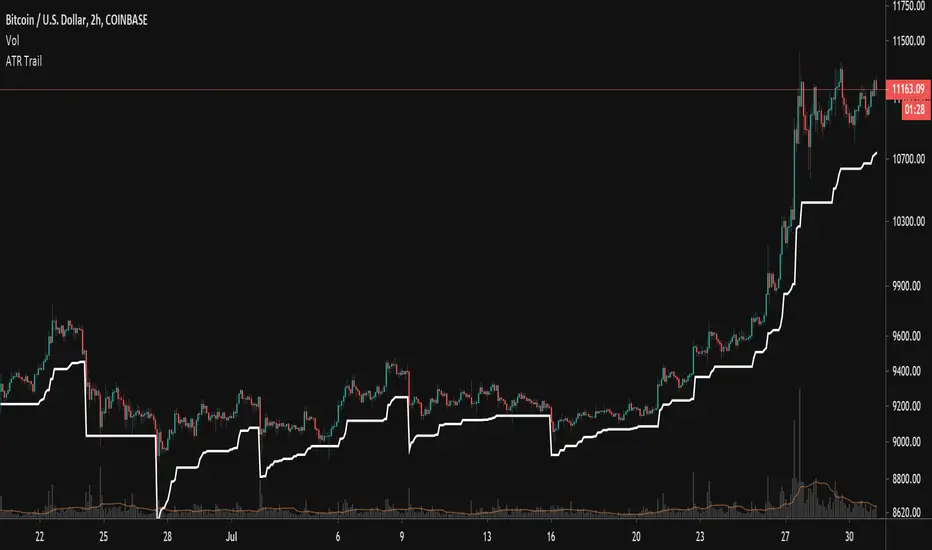
Simple Moving Average - ATR Trailing StopThe old adage goes "Cut losers fast and let the winners run"
With this in mind, this will plot a dynamic trailing stop by subtracting any multiplier of the Average True Range (ATR) from the SMA of your choice.

UT Bot Strategy with Backtesting Range [QuantNomad]UT Bot indicator was inially developer by @Yo_adriiiiaan
Idea of original code belongs @HPotter
I can't update my original UT Bot Strategy so I publishing new strategy with backtesting range included.
I just took code of Yo_adriiiiaan, cleaned it, deleted all useless pieces of code, transformet to v4 and created a strategy from it.
Also I added an input that allows you to swich to signals from Heiking Ashi. I saw that author uses HA for the indicator and on HA it look much nices then on real candles.
Do not add this strategy to HA candles, use usual candles and this checkbox.
Original script:
UT Bot

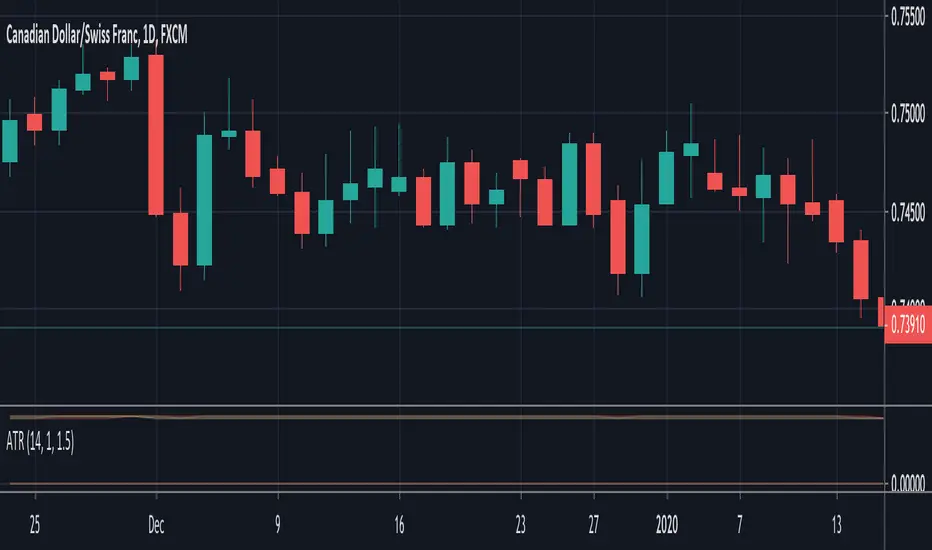
ATR [Gu5]ATR (Average True Range) by Sylvain Vervoort
In contrast to other ATR indicators, the line changes color when profits start
A diferencia de otros indicadores ATR, la linea cambia de color cunado empezamos a tomas ganancias

BEST Supertrend MAHello traders,
That one is an experiment
I was curious to see what a supertrend based on moving average cross could give
How does it work?
Bull event: fast moving average crossing over the slow moving average
Bear event: fast moving average crossing under the slow moving average
When the event is triggered, the script will plot the Supertrend as follow
UP Trend = ohlc4+ ATR * Factor
DOWN Trend = ohlc4- ATR * Factor
Interesting to see the results given by ohlc4 vs hl2 and hl3
Documentation: www.tradingview.com
This is an alternative of the classical Supertrend based on candle close being above/beyond the previous Supertrend level.
Hope you'll enjoy it and it will improve your trading making you a better trader
Dave

BEST Supertrend CCIHello traders
Today I present you a Supertrend not based on candle close but based on a CCI (Commodity Channel Index)
How does it work?
Bull event: CCI crossing over the 0 line
Bear event: CCI crossing below the 0 line
When the event is triggered, the script will plot the Supertrend as follow
UP Trend = High + ATR * Factor
DOWN Trend = Low - ATR * Factor
This is an alternative of the classical Supertrend based on candle close being above/beyond the previous Supertrend level.
Hope you'll enjoy it and it will improve your trading making you a better trader
Dave

Average True Range Percentage (ATRP)ATR measures volatility, but you can't compare one instrument vs. another with it because the ATR value will be different depending on the price of the instrument. I went searching for something like ATR but with percentages, so you could compare one stock vs. another to find who is more volatile and found this .
It was exactly what I was looking for, so decided to re-create it in TradingView. Enjoy!
Description
Average True Range Percent (ATRP) expresses the Average True Range (ATR) indicator as a percentage of a bar’s closing price.
How this indicator works
ATRP is used to measure volatility just as the Average True Range (ATR) indicator is. ATRP allows securities to be compared, where ATR does not.
ATR measures volatility at an absolute level, meaning lower priced stock will have lower ATR values than higher price stocks. ATRP displays the indicator as a percentage, to allow for securities trading at different prices per share to be compared.
Calculation
ATRP = (Average True Range / Close) * 100

Uber Baseline [UTS]Uber Baseline is a highly customizable Baseline component for any trading system. Different strategies can be applied making it a powerful tool for every trader.
General Usage
The Baseline is used as an indication of the prevailing trend and helps keeping the trader out of bad trades.
Price above the Baseline only allows for LONG trades and below Baseline only allows for SHORT trades.
On price cross upwards from below Baseline and and candle close above Baseline the movement can be considered as bullish. Controversy if price crosses Baseline downwards from above and and candle closes below the baseline the movement can be considered as bearish.
Hence, ENTRY Signals for LONG or SHORT can be derived from those Baseline crosses.
Furthermore, any Baseline cross can also be treated as valid EXIT signal for an open position as the movement indicates a possible shift in trend.
Price that moves with unusual high volatility into one direction often tends to not trend but instead pulls back. Overshoot of the base line (default setting: 1x ATR) is recognized but does not produce an ENRTY signal, only an EXIT signal.
Advanced techniques can incorporate the one-candle-rule waiting for pullbacks after Baseline overshot following a possible ENTRY in direction of the new trend.
Trend traders can also look for Baseline bounces after an ENTRY signal for confirmation and better trade entries.
Moving Averages
16 different Moving Averages are available:
ALMA (Arnaud Legoux Moving Average)
DEMA (Double Exponential Moving Average)
EMA (Exponential Moving Average)
FRAMA (Fractal Adaptive Moving Average)
HMA (Hull Moving Average)
JURIK (Jurik Moving Average)
KAMA (Kaufman Adaptive Moving Average)
Kijun (Kijun-sen / Tenkan-sen of Ichimoku)
LSMA (Least Square Moving Average)
RMA (Running Moving Average)
SMA (Simple Moving Average)
SuperSmoothed (Super Smoothed Moving Average)
TEMA (Triple Exponential Moving Average)
VWMA (Volume Weighted Moving Average)
WMA (Weighted Moving Average)
ZLEMA (Zero Lag Moving Average)
A freely determinable length allows for sensitivity adjustments that fits your own requirements.
Trend Visualization
If the predominant trend direction is DOWN the moving average is painted red. If the trend direction is UP the moving average is painted in green.
If the movement is FLAT then the color is gray.
Alerts
Traders can utilize the following signals to trigger alerts from:
Bull Cross
Bear Cross
Overshoot Up
Overshoot Down
Those values are > zero if a condition is triggered.
Alert condition example: "Bear Cross" - "GreaterThan" - "0"

Uber ATR [UTS]Uber ATR is a customizable ATR indicator that measures volatility within a given time frame.
The indicator tells about how much price fluctuates but does not say anything about how much it actually moves into one direction. Use trend following indicators for that purpose.
Option: Exclude Unfinished Candle
Option to exclude the current unfinished candle from price calculation to ignore sudden spikes in price action.
Default caluclation based on candle close:
Exclude unclosed candle option:
Option: Display "Old" Values
Option to step back by candle and display old ATR values in a human readable fashion.
Option: Smoothing Types
NONE (Raw ATR value, no smoothing is applied)
ALMA (Arnaud Legoux Moving Average)
DEMA (Double Exponential Moving Average)
EMA (Exponential Moving Average)
FRAMA (Fractal Adaptive Moving Average)
HMA (Hull Moving Average)
JURIK (Jurik Moving Average)
KAMA (Kaufman Adaptive Moving Average)
Kijun (Kijun-sen / Tenkan-sen of Ichimoku)
LSMA (Least Square Moving Average)
RMA (Running Moving Average)
SMA (Simple Moving Average)
SuperSmoothed (Super Smoothed Moving Average)
TEMA (Triple Exponential Moving Average)
VWMA (Volume Weighted Moving Average)
WMA (Weighted Moving Average)
ZLEMA (Zero Lag Moving Average)

ATR CHANNEL .2Channel based on 100MA & daily ATR / volatility - whole point is to warn and show you where not to participate. Signals can be considered as higher probability trades, short term reversal type scalps - especially effective at FX and stock trading

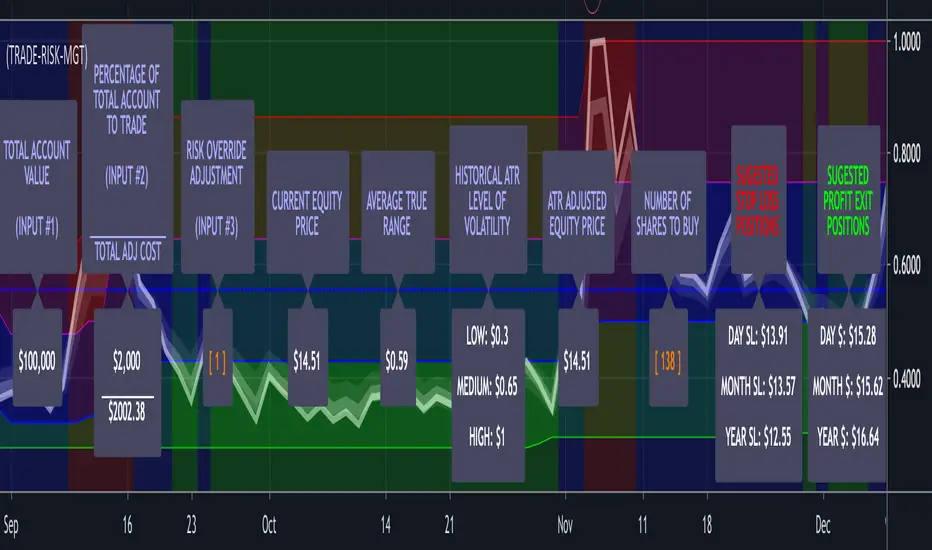
(17) Trade Risk Management VS-427)Trade Risk Management is an Average True Range (ATR) indicator and a Risk Management Worksheet combined. Think widget, spreadsheet or worksheet that calculates how much you should invest in any equity. This enables the trader to very quickly determine the level of volatility of any equity, allowing them to adjust their entry position size based on current and historical volatility . This is a simple and effective risk management tool. The trader only needs to enter the first three label values through the input/styles panel. Historical Volatility is determined via a 60 day/bar look-back for the highest high and the lowest low of the ATR. These two figures are utilized to stratify three background bands (Red = High Volatility; Blue = Median Volatility; and Green = Low Volatility.) The labels are then plotted on the center-line value representing the historical volatility of the equity in question. The label color represents the current volatility of the equity. This indicator is free to any subscriber of any Genie indicator package.
Enter the total value of all of your investments (stocks, cryptos, cash) in input #1 which will then be displayed in Label #1.
You enter the percentage of your account value you are willing to risk on any trade in input #2 which is then displayed in Label #2.
Input #3 allows you to override the built-in risk evaluation based on ATR. Label #3.
Label #4 shows the current equity trading price.
Label #5 shows the current ATR of the equity.
Label #6 shows three levels of historical volatility reflected in the three bands (RED, BLUE, GREEN) shown on the chart.
Label #7 shows the adjusted equity price based on current ATR. If the current ATR is High; Top Red Band, the amount is increased by the (ATR * Risk Factor) Adjustment. Because this increases you're calculated cost basis the number of shares you are indicated to buy is decreased, reducing your exposure to risk in a high volatility/risk environment. If the ATR is Low: Bottom Green Band, the amount is decreased by the (ATR * Risk Factor) Adjustment. Because this decreases your calculated cost basis the number of shares you are indicated to buy is increased because you are in a low volatility/risk environment. If the ATR is neutral: Middle Blue Band, the actual equity cost is utilized and no risk weighting based on ATR is incorporated.
Label #8 shows the resulting change in the price that the risk weighting calculation above had on current price.
Label #9 indicates the recommended number of Risk-Managed-Shares the trader should purchase.
Label #10 indicates the suggested Stop Loss levels and Label #11 shows the suggested Profit Exits Levels.
To further emphasize that the Labels are the Indicator, they get plotted on a line that plots at the center of the current volatility level. If you bring up this indicator and run through one of your trading symbol list, it will enable you to immediately determine exactly what the level of current and historical volatility each of the equities in your list is experiencing.
Additionally, the color of the text on all of the descriptive labels plotted above the center line change color based on the current level of volatility.
Access this Genie indicator for your Tradingview account, through our web site. (Links Below) This will provide you with additional educational information and reference articles, videos, input and setting options and trading strategies this indicator excels in.
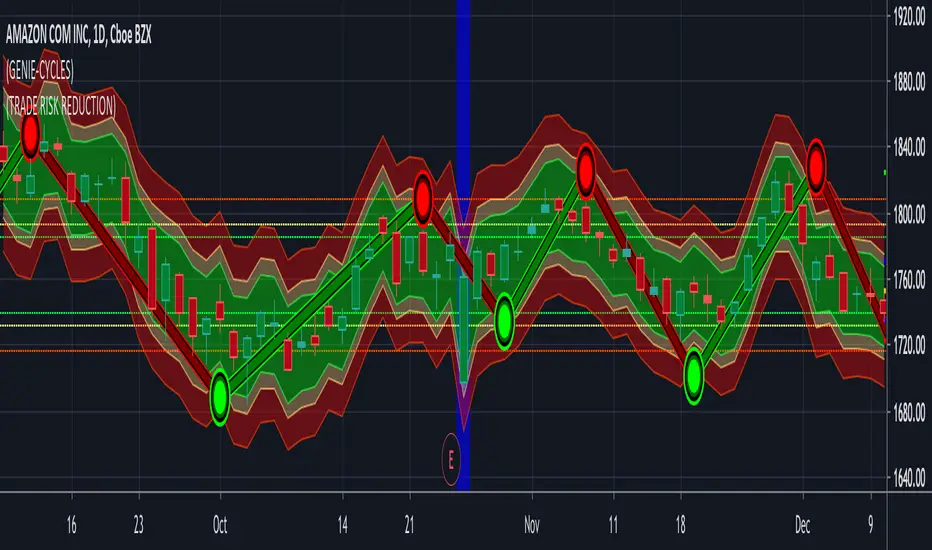
(15) Trade Risk Reduction VS-132TRR calculates the volatility of your stock. This is just the magnitude of each days price fluctuations, or what technicians refer to as the True Range. TRR averages the True Range (ATR) over three different time periods.
Why three? You want a sensitive indicator that reflect both the long term historical volatility of the equity as well as what that volatility is right now. Obviously the most recent trading days are the most important. The three ATR periods and their weighting factors are:
1) We use a 251 day period which equates to 1 trading year because we want to know what the historical volatility is. This one year period is not weighted.
2) We utilize a 21 day period because the most recent weeks tells us what the stock volatility has been over the previous calendar month. This is weighted by a factor of 2.
3) Finally, we utilize the last weeks data, Last 5 days, (L5D) to provide us with the stocks movement in the most recent trading days. This is weighted by a factor of 4.
The total of ATR251*(1) + ATR21*(2) + ATR5*(4) is then divided by the total of all factors (7).
This results in the Weighted Average True Range that the Trade Risk Reduction utilizes to produce the dynamic bands on your charts as well as power the Risk and Stop loss calculators. These indicate where this indicator is currently recommending you place stops. In the Format options of the application you are provided with the ability to adjust these band. Keep in mind that each stock will act in it's own unique and characteristic way. Looking closely at the stock's historical data, both in longer and shorter time periods should provide you with some insight into the normal variations and fluctuations of this particular equity. Below EBAY provides an example of this.
Access this Genie indicator for your Tradingview account, through our web site. (Links Below) This will provide you with additional educational information and reference articles, videos, input and setting options and trading strategies this indicator excels in.
High and Lows + ATRScript is showing previous year, month and day high and low, plus ATR range from the open price on the current day.


Maximum True RamgePlots the the highest true range for the entire dataset.
Beneficial for determine an emergency stopp loss.

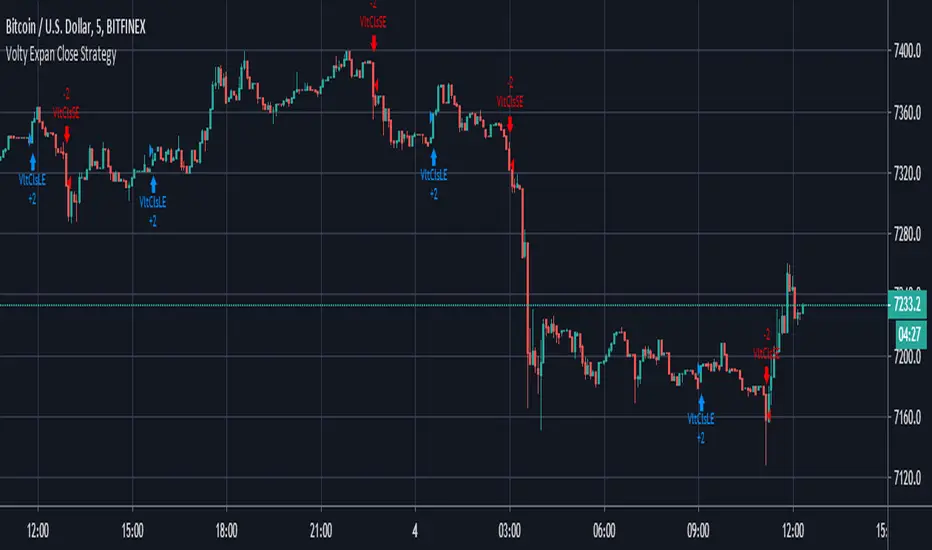
Volty Expan Close Strategy with Backtest Date RangeInput Information
Length Numeric 5 Number of bars used to determine the average true range.
NumATRs Numeric .75 Factor used to calculate a percentage of the average true range, used to
Long and short entry based on a percentage of price movement beyond the average range.
Profitable and simple strategy..
Trailing ATR StopsThis script plots a trailing stop of the ATR multiplied by a user-defined number. Since it is meant to be used as a trailing stop, the value doesn't fluctuate with the price as a normal ATR indicator does, but stays fixed unless price moves away from it. In that case it follows the price. If price crosses the stop level, it resets itself based on current price and starts trailing all over again.
User Settings:
Support - Use for a trailing stop while long
Resistance - Use for a trailing stop while short
Both - Acts like a channel and can spot periods of lower volatility