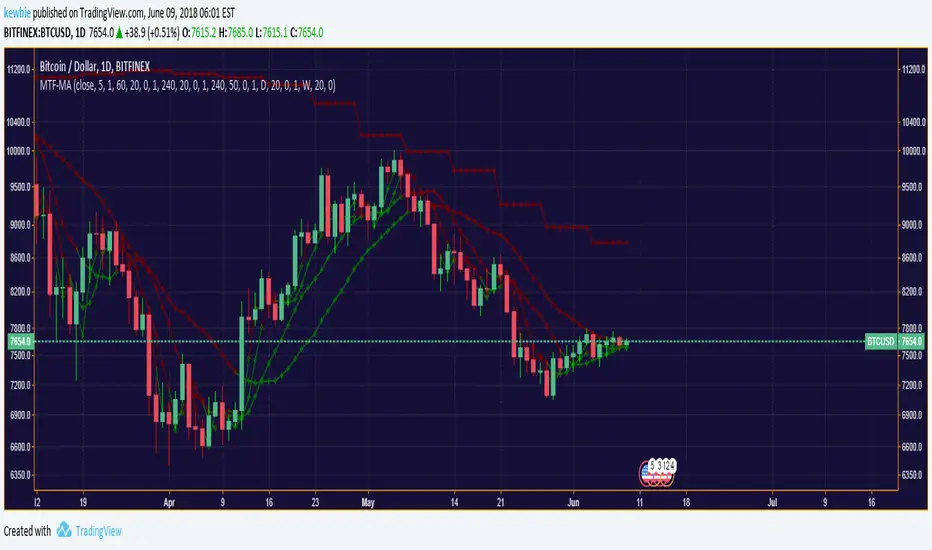
Triple guppy w/ up/down colours - squattterThe trend is your friend.
Works well on 2hr TF which shows 30+60 ema from 8hr and Daily TFs.
Use a higher TF momentum indicator such as TRIX to confirm.
Average

Auto-Line With DriftA variation on the Auto-Line indicator, we allow it to get closer to the price thanks to a drift , this also allow the line to be more directional .
This indicator can be used with moving averages using crosses as signals or as a band indicator by ploting a + dev as the upper band and a - dev as the lower one.
For any help or suggestions feel free to send a message :)

Multi Z Score [DW]This is an experimental study using z scores of multiple sampling periods to analyze price trends.
Z score measures the number of standard deviations price is from its mean.
In this study, z scores are calculated over a Fibonacci sequence of sampling periods from 3 to 4181.
The scores are then averaged with equal weighting, resulting in a display of long term trend with short term sensitivity.
Custom bar colors are included. The color scheme is based on the perceived trend from the average z score.

Earnings Support and Resistance Levels [NeoButane]Inspired by @LazyBear's/@timwest's script:
Usage: support and resistance levels based on averaging price around earnings and quarterly opens.
What it is plotting:
1. A horizontal level whenever earnings occur. If actual earnings is higher than estimated, the line turns green, else red.
2. A horizontal level every quarterly open, colored black.
3. An average between the two mentioned above, colored orange.
4. 5% moves away from 3M open and earnings
5. Misc: 5% move away from that 5% move away, then 10% move away from the 2nd 5% move away.
By default, 4 and 5 are off to reduce visual noise.
Idea: Traders panic around certain dates that always happen, and traders always panic in the wrong direction. The market is composed of traders trading in the wrong direction at the same time, all the time. That means price will bounce back and forth as the gambling dens colloquially known as 'forex brokerages' or 'stock exchanges' take your money in the form of fees, time, and liquidations. So I put two lines on the chart and put one right in between, because it always goes back. I hope you can find it useful!
Note: This was a part of the old fundamental data indicators and is not officially for use, so while it should work on most U.S. stocks and a couple of other exchanges, it is not perfect.

Ehlers Distance Coefficient FilterThis indicator was described by John F. Ehlers in his book "Rocket Science for Traders" (2001, Chapter 18: Ehlers Filters).
15minMAThis script lets you plot a simple or exponential moving average from a specific time frame that you can select. For example, if you always want the Daily 50MA on your chart, regardless of what resolution your chart is on, this will do it. It's also color coded to show if it's rising or falling.


Average Directional Index-BuschiA simple modification of the built-in "Average Directional Index":
To identify wether there is an uptrend or a downtrend, the function color is conditional:
no trend: black
small uptrend (weak threshold): light green
big uptrend (strong threshold): green
small downtrend (weak threshold): light red
big downtrend (strong threshold): red

Ehlers FilterThis is the Adaptive Ehlers Filter.
I had to unroll the for loops and array because TV is missing crucial data structures and data conversions (Arrays and series to integer conversion for values).
I'm in the process of releasing some scripts. This is a very old script I had. This contains volatility ranges and can be used as trading signals. You can also see how the EF moves up or down, the direction, when price is sideways, and use price breaks up and down as signals from the line.
Have fun, because I didn't making this script hahaha
NOTE : There is an issue with the script where at certain time frames it positions itself below or above. I think its due to calculations. If anyone knows the fix before I get the chance to take a look at it, please let me know.
books.google.com

5 Moving Average Exponential 7-15-30-50-2005 Moving Average Exponential. Crypto EMA. 7 is a fast support or resistance, 15 confirmation support or resistance. 30 Important support and resistance. 50 institutional support or resistance. 200 general trend, support and resistance.

Moving average cloud strategyHi folks!
Here a script uses the moving average cloud. A sma (50, aqua) and a sma (200, olive) are plotted on the cart. When both sma go up the cloud is green. When both sma go down the cloud is red. When sma (200, olive) goes down and sma (50, aqua) goes up the cloud is orange. When sma (200, olive) goes up and sma (50, aqua) goes down the cloud is lime.
There three entry points in this strategy.
Long
Aggressive: When the cloud turns orange and price closes above the sma (200).
Neutral: When the both sma make the golden cross.
Cautious: When the cloud is green and price closes sma (200) after searching for support. So not when there's a great distance between them.
In case you missed the entry point you can jump in when price CLOSES above sma (50). So after it searched for support on that line. The cloud has to be green at that moment.
Short
Aggressive: When the cloud turns lime and price CLOSES below the sma (200).
Neutral: When the both sma make the death cross.
Cautious: When the cloud is green and price is above the sma (200).
In case you missed the entry point you can jump in when price CLOSES above sma (50). So after it searched for support on that line.
There are also two exit points in this strategy.
Cautious: When price closes on the other side of the sma (50).
Neutral: When the cloud changes color.
Aggressive: When price closes on the other side of the sma (200). There's always the opportunity that the price searches for support at the sma (200) line and goes from that moment in the direction you want.
Don't wait for the cross of the both sma. Very usually you give a huge part of your profit away at that point.
Remember: Above the cloud is bullish area, never go short there. Below the cloud is bearish area, never go long there.
Remember 2: When the clouds changes rapidly from color we're not in a trend. The sma (200) will be almost flat at those situations. It's a sign not to go into a trade since the market doesn't know in which direction it will go.

Leeloo Triple Simple Moving AverageAllows you to have three simple moving averages in one indicator.


6 SMA's (fit to BTC) 9,20,30,50,128,200 (exponential optional)I've been using these for a while trading Bitcoin and I've found them to be the most useful to me. I replaced the 7 you may have seen in the first set with the 9 as I'm seeing it tested across many time frames quite frequently. The least used of the six is the 30 period, but it does have some influence I've found on the large time frames, mainly the weekly.

crashm111 3-200 Moving Average RibbonAll the moving averages bewteen 3 and 200 in increments of 5.
with the ability to change colours
and change between simple and exponential.
It provides an easy and fast way to determine the trend direction and possible reversals.

Ultimate 'Multi-Timeframe' Multi-AveragesPlots different kinds of averages (EMA, SMA, SMMA, WMA, VWMA) referred to a fixed timeframe/period indipendent from the one that you are watching (example: plot daily EMA on the 4h chart).
Highlights the crossing of averages.
Multiple Timeframe Moving Average SystemModified code from ChrisMoody, RicardoSantos & Ricardo M Arjona.
Allows for multiple moving average types across custom time-frames.
Simple Moving Averages (7, 30, 50, 100, 200)7, 30, 50, 100, 200 simple moving averages, bundled in one indicator (for users who are using the free TradingView service and can only load limited number of indicators at any given time).
You can turn each moving average on or off at will and change the colors.

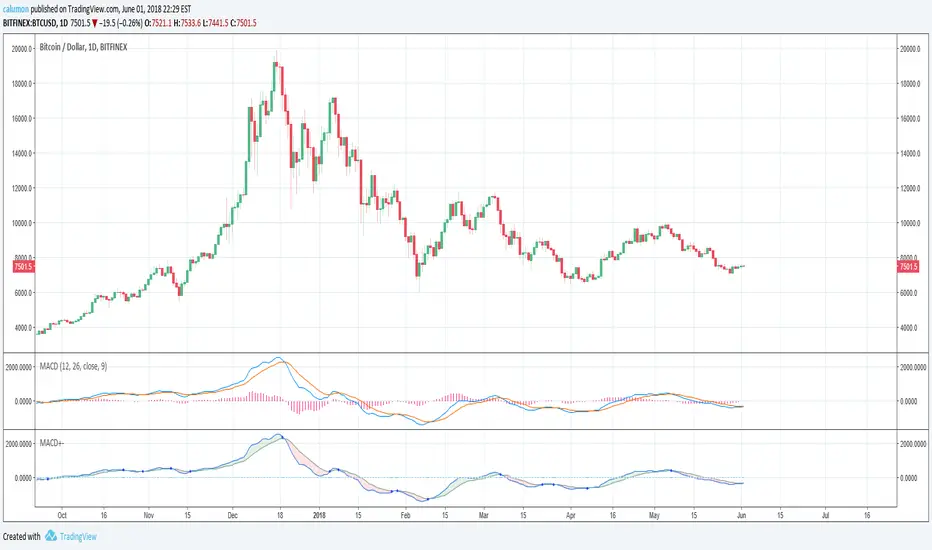
MACD with highlighted positive and negative trendThe values used by this indicator are equal to MACD 12 26 9 (and Signal). Only changes are made to looks:
If MACD closes higher than Signal, then we are seeing green. Else, we are seeing red.
Another point is that we get a blue circle when there is a trend change from bullish to bearish or vice versa. Please note that there needs to be an offset for this. We will only see the circle, when there already WAS (instead of is) a trend change.
3 Moving Average ExponentialSince I noticed there was no Script with actually 3 EMA together (all the ones I found said it was Exponential, but actually was Simple), i created this one.
The lengths, 17 72 305, are based on the phi cube theory, introduced by Bo Williams. The slow length (305) indicate a likely strong support/resistance and the region between the fast and medium lengths (17, 72) indicate where the price tends to return after a boost or little diversion from the price average.

SMA/EMA 12|26|50SMA/EMA 12|26|50
Exactly as title says
SMA is bold
EMA is light
Orange 12
Green 26
Blue 50