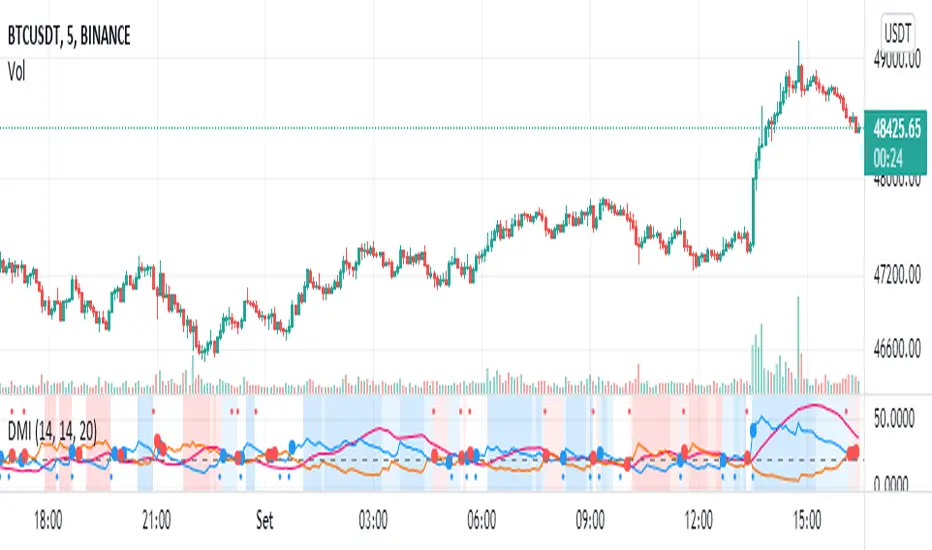
DMI - VisualBasically, when the background is:
White = no defined direction
Light blue = up.
Dark blue = well defined up
Light red = down
Dark red = well defined down
Blue/red centered circle = change of direction
Red circle on top = possible short entry
Blue circle at the bottom = possible long entry
//Português
Basicamente, quando o fundo é:
Branco = sem direção definida
Azul claro = alta
Azul escuro = alta bem definida
Vermelho claro = baixa
Vermelho escuro = baixa bem definida
Círculo azul/vermelho centrado = mudança da direção
Círculo vermelho no topo = possível entrada de short
Círculo azul na parte inferior = possível entrada de long
מדד כיווני ממוצע (ADX)
Forex Scalping 1min Bollinger Bands, RSI and ADX Trading SystemThis is a Forex Scalping Trading Sytem based on the Bollinger Bands.
Its suited for major pairs, with lowest possible comission (below 1 pip) and with timeframes ranging between 1-15 min.
Indicators:
Bollinger bands
ADX
RSI
Rules for entry:
Long Entry: price to move below the upper Bollinger Bands RSI raise above the 30 line and ADX<32 at the same time.
Short Entry: price to move above the upper Bollinger Bands, RSI raise below the 70 line and ADX<32 at the same time.
Rules for exit
Profit Exit: 3 options: 1, exit position when the price touches the middle band, 2) when the price touches the opposite band, X pips target profit.
Loss Exit: X pips loss

DMI Swings (by Coinrule)The Directional Movement Index is a handy indicator that helps catch the direction in which the price of an asset is moving. It compares the prior highs and lows to draw three lines:
Positive directional line (+DI)
Negative directional line (-DI)
Average direction index (ADX)
DMI is simple to interpret. When +DI > - DI, it means the price is trending up. On the other hand, when -DI > +DI, the trend is weak or moving on the downside.
The ADX does not give an indication about the direction but about the strength of the trend.
Typically values of ADX above 25 mean that the trend is steeply moving up or down, based on the -DI and +D positioning. This script aims to capture swings in the DMI, and thus, in the trend of the asset, using a contrarian approach.
ENTRY
-DI is greater than +DI
ADX is greater than 45
EXIT
+DI is greater than -DI
ADX is greater than 45
Trading on high values of ADX, the strategy tries to spot extremely oversold and overbought conditions. Values of ADX above 45 may suggest that the trend has overextended and is may be about to reverse.
Our backtests suggest that this script performs well for very short-term scalping strategies on low time frames, such as the 1-minute.
The script considers a 0.1% trading fee to make results more realistic to those you can expect from live market conditions. So realistically, live results should be similar to backtested results.
You can plug this script directly into your crypto exchange using TradingView Signals on Coinrule.
Trade Safely!

Pumpkin Soup MACD Profit CandlesMACD-based Relative Stock Price Candle
It was a mixture of MACD and a combined centered oscillator, indicating relative stock bar movement.
It moves approximately between 200 and -200, adding a divergence.
In addition to Hidden Diversions and Normal Diversions, I added the Long Short Diversions and the Preview Diversions that I analyzed.
It would be convenient if you think of it as a mix of general stochastic and MACD.
/////
MACD 기반 상대 주가봉 캔들
MACD와 종합 센터드 오실레이터의 혼합형으로 상대적인 주가봉 움직임을 나타내었습니다.
대략적으로 200 ~ -200 구간에서 움직이며, 다이버전스를 넣었습니다.
히든 다이버전스, 일반 다이버전스 외 제가 분석한 롱 숏 다이버전스와 예고 다이버전스도 첨가하였습니다.
일반적인 스톡캐스틱와 MACD의 혼합형이라고 생각하시면 편하실듯합니다.

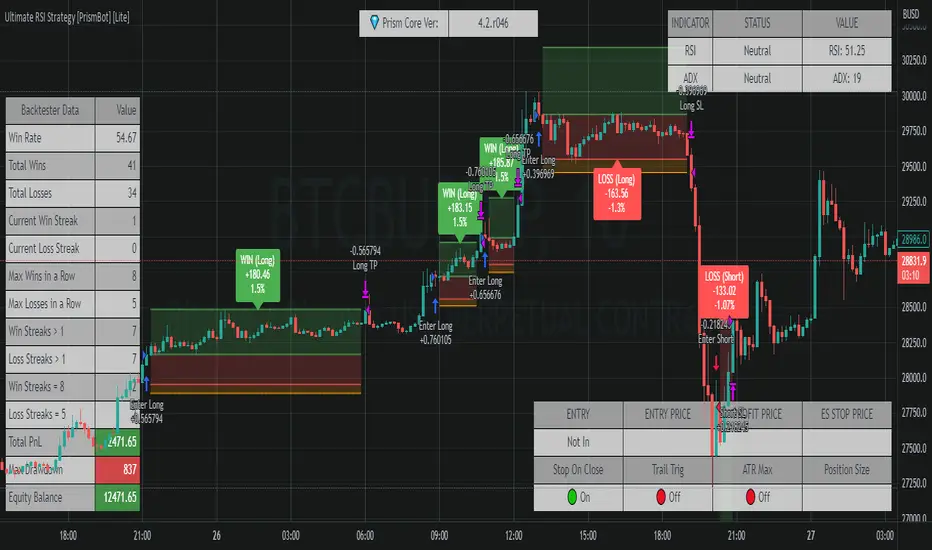
Ultimate RSI Strategy [PrismBot] [Lite]Included in this Ultimate MACD Lite Strategy:
✔️ Tweak a multitude of specific settings (MA lengths, R:R, SL distance etc)
✔️ Enable advanced setup filters
✔️ Use money management and risk calculations
✔️ Draw trade info directly to chart (eg. SL size in percent, win rate etc)
✔️ Use various filters (eg. time filter, date filter, MA slope angle etc)
✔️ Manage risk per position when auto-trading forex through AutoView
✔️ Choose from various alert conditions!
✔️ Sync to any bot or algorithmic trading system
Some details about this strategy:
There are several strategies that people use for the RSI , and one of my favorites is very different than one you have probably heard from every online RSI strategy source.
In order to compliment the RSI , there is also a built-in ADX / DMI strategy (per our All-In-One strategy on my profile as well) and you will also find a Global Trend filter (200 EMA by default).
You can also use a pullback confirmation prior to a trade entering. I.E., you have the RSI signal, wait for a pullback to the pullback EMA , and then the strategy will enter a trade.
You can easily enable and disable strategies using the checkbox.
This strategy incorporates a risk to reward system where the user can select between ATR and Percent based stop losses and take profit targets. This means that the user has much better control over money management when utilizing this strategy and it doesn't require you to babysit the strategy to ensure it's entering and existing strategies in an ideal place.
Ultimate MACD Strategy [PrismBot] [Lite]Included in this Ultimate MACD Lite Strategy:
✔️ Tweak a multitude of specific settings (MA lengths, R:R, SL distance etc)
✔️ Enable advanced setup filters
✔️ Use money management and risk calculations
✔️ Draw trade info directly to chart (eg. SL size in percent, win rate etc)
✔️ Use various filters (eg. time filter, date filter, MA slope angle etc)
✔️ Manage risk per position when auto-trading forex through AutoView
✔️ Choose from various alert conditions!
✔️ Sync to any bot or algorithmic trading system
Some details about this strategy:
LONG SIGNAL
When the MACD is below the zero line of the histogram, close is above the 200EMA, and the MACD line crosses above the signal line, longs are taken
SHORT SIGNAL
When the MACD is above the zero line of the histogram, close is below the 200EMA, and the MACD line crosses below the signal line, shorts are taken
A couple of options are given for how to calculator stop losses.
The Take profit is calculated by the risk of the stop loss. So a 1.5 take profit target is 1.5 times the stop loss added to the entry price.
There is also an option to filter out trades by the histogram deviation. This prevents crossovers that are too close to the histogram from being taken.
Please note I used the code for the PPO instead of the traditional MACD to make calculating these percentage deviations more consistent across multiple asset types.
You can easily enable and disable strategies using the checkbox.
This strategy incorporates a risk to reward system where the user can select between ATR and Percent based stop losses and take profit targets. This means that the user has much better control over money management when utilizing this strategy and it doesn't require you to babysit the strategy to ensure it's entering and existing strategies in an ideal place.
You can also enter custom messages for alerts for use with bots (set alerts to "alert() function calls only")

Keltner Worm Strategy [PrismBot] [Lite]Included in this Keltner Worm Lite Strategy:
✔️ Tweak a multitude of specific settings (MA lengths, R:R, SL distance etc)
✔️ Enable advanced setup filters
✔️ Use money management and risk calculations
✔️ Draw trade info directly to chart (eg. SL size in percent, win rate etc)
✔️ Use various filters (eg. time filter, date filter, MA slope angle etc)
✔️ Manage risk per position when auto-trading forex through AutoView
✔️ Choose from various alert conditions!
✔️ Sync to any bot or algorithmic trading system
Some details about this strategy:
- it incorporates 2 strategies - Keltner Re-entry and Baseline MA Crossing
- it uses a take profit and stop loss level fixed
- there are up to 6 allowable "worms"
- the worm multipliers are exponential, so a value of 2 will mean that the 6th worm is multiplied by 6
- you can multiply the offset or the Keltner Channel default values
- You can enable alerts for order entry, take profit, and stop loss values
- You can easily enable and disable strategies using the checkbox.
- This strategy incorporates a risk to reward system where the user can select between ATR and Percent based stop losses and take profit targets. This means that the user has much better control over money management when utilizing this strategy and it doesn't require you to babysit the strategy to ensure it's entering and existing strategies in an ideal place.

[VJ] Hulk Smash IntraThis is a simple intraday strategy for working on Stocks or commodities based out on Super Trend and ever reliable ADX . You can modify the start time and end time based on your timezones. Session value should be from market start to the time you want to square-off
Important: The end time should be at least 2 minutes before the intraday square-off time set by your broker
Comment below if you get good returns
Strategy: Supertrend and ADX strength (Hulk Smash)
Indicators used :
Super trend is simple and easy to use indicator and gives a precise reading about an on going trend.It is built with two parameters, namely period and multiplier.The Buy and Sell signal modifies once the indicator tosses over the closing price. When the Super trend closes above the Price, a Buy signal is generated, and when the Super trend closes below the Price, a Sell signal is generated. In this case we use it only for direction .
ADX informs a trader when the market is trending.It filters out anti trend trades to help trend chasing indicators from frequent whipsaws
Multiplier is a vital input for Super trend. If the multiplier value is too high, then lesser number of signals is made.
Buying/Selling
• If the price is going UP, and the ADX indicator is also going UP, then we have the case for a bullish trend.
• The same is true if the price is going down and the ADX indicator is going UP. Then we have the case for a bearish trend.
• Value of ADX below 20 is called trading zone which implies non-trending market
• Trade with Strength only if the Super trend is validating
ADX Values
0 - 20 : Non Trending (Range bound market, phase of Accumulation/Distribution)
20-45 : Strong Signal (helpful for traders)
45-60 : Very strong trend (occur rarely, indicate exhaustion)
60 - 100 : Extremely strong trend (very rare, unsustainable trends, be ready for reversals)
Usage & Best setting :
Choose a good volatile stock and a time frame - 5m.
ADX Factor : vary as per info above
ST multiplier : 3
There is stop loss and take profit that can be used to optimise your trade
The template also includes daily square off based on your time.

ADX MULTICOLOR
ENGLISH:
ADX (AVERAGE DIRECTIONAL INDEX):
It is a non-directional oscillator type indicator, that is, it quantifies the strength of a trend regardless of its direction. In Spanish ADX means index of average direction. It is common to use it together with directional indicators of movement such as the (Squeeze Momentum Indicator), which show us the direction or predominant trend of the market.
HOW TO USE THE ADX INDICATOR
When the ADX is greater than 30, the market is in a strong trend, when it is between 23 and 30 it is not well defined and when it is less than 23 it indicates that the market is in range.
QUANTIFYING THE STRENGTH OF TREND:
ADX values help traders identify the strongest and most profitable trends to trade. Values are also important to distinguish between trending and non-trending conditions. Many traders will use ADX readings above 23 to suggest that the trend is strong enough for trend trading strategies. Conversely, when the ADX is below 23, many will avoid trending trading strategies.
ADX value Trend strength
0-23 Trend absent or weak
23-30 Strong trend
30-75 Very strong trend
75-100 Extremely strong trend
+ DI: (Green Color)
The + DI (Positive Directional Indicator) would be the indicator of positive direction and it would be showing us that the movements are trending upward.
-DI: (Red Color)
The –DI (Negative Directionl Indicator) would be the indicator of negative direction and it would be showing us that the movements have a downward trend.
IMPROVEMENTS IN THE DEVELOPMENT OF THE OSCILLATOR:
It is known that the ADX as a whole is composed of three lines, the first is the ADX itself, which measures the strength of the trend, when it has upward directionality, it means that there is strength in the movement.
The other two lines named (+ DI and -DI) mark if the force is bearish, bullish or, failing that, neutral.
When the + DI is above the -DI, it speaks of Bullish force. On the contrary, when these lines are reversed, we would be in the presence of a bearish force.
On the other hand, when the ADX is below the 23 point, it is considered that there is no force in the movement.
FUSION OF ADX AND LOS (+ DI and -DI):
To simplify this vision, we have merged the three lines that we talked about at the beginning of this section, attributing the color resulting from the crosses of the (+ DI and -DI) to the ADX itself, resulting in a single line that has the color of the type of present force.
CANDLE COLOR:
To help the more inexperienced trader, we have activated a function that will paint the candles the color of the ADX, providing a visual aid to the trader using this indicator.
THE ADX HAS 5 COLORS:
• ADX: Dark Green (Bullish force).
• ADX: Light Green (Loss of bullish strength).
• ADX: Dark Red (Bearish Force).
• ADX: Light Red (Loss of bearish strength).
• ADX: Orange (Lost strength, Disinterest and low volume).
NOTE:
It is possible to activate the lines (+ DI and -DI) in the indicator if you want to use the indicator independently, however, it is recommended to combine this indicator with a directional oscillator, such as the Squeeze Momentum Indicator.
---------------------------------------------------------------------------------------------------------------------------------------------------------------------------------------------------------------------------------------------------
ESPAÑOL:
ADX (ÍNDICE DIRECCIONAL PROMEDIO):
Es un indicador de tipo oscilador no direccional, es decir, cuantifica la fuerza de una tendencia independientemente de su dirección. En español ADX significa índice de dirección media. Es común usarlo junto con indicadores direccionales de movimiento como el (Squeeze Momentum Indicator), que nos muestran la dirección o tendencia predominante del mercado.
CÓMO USAR EL INDICADOR ADX
Cuando el ADX es mayor a 30, el mercado está en fuerte tendencia, cuando está entre 23 y 30 no está bien definido y cuando es menor a 23 indica que el mercado está en rango.
CUANTIFICACIÓN DE LA FUERZA DE LA TENDENCIA:
Los valores de ADX ayudan a los operadores a identificar las tendencias más fuertes y rentables para operar. Los valores también son importantes para distinguir entre condiciones con tendencia y sin tendencia. Muchos operadores utilizarán lecturas de ADX por encima de 23 para sugerir que la tendencia es lo suficientemente fuerte para las estrategias de negociación de tendencias. Por el contrario, cuando el ADX está por debajo de 23, muchos evitarán las estrategias comerciales de tendencia.
Valor ADX Fuerza de la tendencia
0-23 Tendencia ausente o débil
23-30 Fuerte tendencia
30-75 Tendencia muy fuerte
75-100 Tendencia extremadamente fuerte
+ DI: (Color verde)
El + DI (indicador direccional positivo) sería el indicador de dirección positiva y nos estaría mostrando que los movimientos tienen una tendencia alcista.
-DI: (Color rojo)
El –DI (indicador de dirección negativa) sería el indicador de dirección negativa y nos estaría mostrando que los movimientos tienen una tendencia a la baja.
MEJORAS EN EL DESARROLLO DEL OSCILADOR:
Se sabe que el ADX en su conjunto está compuesto por tres líneas, la primera es el propio ADX, que mide la fuerza de la tendencia, cuando tiene direccionalidad ascendente, significa que hay fuerza en el movimiento.
Las otras dos líneas denominadas (+ DI y -DI) marcan si la fuerza es bajista, alcista o, en su defecto, neutral.
Cuando el + DI está por encima del -DI, habla de fuerza alcista. Por el contrario, cuando estas líneas se invierten, estaríamos en presencia de una fuerza bajista.
Por otro lado, cuando el ADX está por debajo del punto 23, se considera que no hay fuerza en el movimiento.
FUSIÓN DE ADX Y LOS (+ DI y -DI):
Para simplificar esta visión, hemos fusionado las tres líneas de las que hablamos al principio de esta sección, atribuyendo el color resultante de los cruces de (+ DI y -DI) al propio ADX, dando como resultado una sola línea que tiene el color del tipo de fuerza presente.
COLOR DE VELAS:
Para ayudar al trader más inexperto, hemos activado una función que pintará las velas del color del ADX, proporcionando una ayuda visual al trader que usa este indicador.
EL ADX TIENE 5 COLORES:
• ADX: Verde oscuro (fuerza alcista).
• ADX: Verde Claro (Pérdida de fuerza alcista).
• ADX: rojo oscuro (fuerza bajista).
• ADX: Light Red (Pérdida de fuerza bajista).
• ADX: Naranja (Pérdida de fuerza, Desinterés y bajo volumen).
NOTA:
Es posible activar las líneas (+ DI y -DI) en el indicador si desea utilizar el indicador de forma independiente, sin embargo, se recomienda combinar este indicador con un oscilador direccional, como el Squeeze Momentum Indicator.

Confluence TradingThis indicator makes use of the Kumo Cloud, 3EMA and ADX/DI+/DI- indicators. While these can be used separately (green bars show where to long and red bars show where to short), this indicator also shows how their use together can create a more precise estimate on when to enter and exit the market. It is interesting to note that while each of the three indicators individually can predict movements and trend reversals early, having their signals converge into one makes a slower prediction but also a more accurate one. It is a great visual representation of why combining multiple trading techniques or analysis increases odds of winning trades (confluence trading). Do feel free to message me if you wish for me to add any other indicator to the mix or to fix any bugs. The ADX indicator makes use of robertkowalski's code.

DCA_PREMIUMOur new indicator tracks trends to create buy and sell alerts, see below how it works.
HOW IT WORKS:
It uses RMA which is the same moving average used by RSI and HMA, they intersect give us an entry signal, be it a buy or sell, as the entry signal the script will color the bars according to the signal.
When a GREEN candle appears, it indicates a large purchase volume and when a PURPLE candle appears, it indicates a large sales volume.
The indicator will alert for entries only according to the trend of the traded asset
FOR EXAMPLE:
I am trading USDJPY in an uptrend, the indicator will only alert me for buy entries, if it applies to downtrend.
DASHBOARD:
Our dashboard indicates the volatility of the traded asset, the short-term trend and the trade signal.
HOW TO USE:
Choose the asset you want to trade and, in the settings, change the time period you want for your trading style, for example: Swing Trade, Day Trade or Position.
See regions with large trading volumes indicating price manipulation or just supports and resistances too strong to break.

Natural Directional Combo [CC]The Natural Directional Combo was created by Jim Sloman as part of his Ocean theory series and I believe this is his final unique formula that I'm publishing to make them all open source. If you know of any others then please send me a message. He passed away at a young age and I want to make sure his legacy lives on. Big thanks to @altcoinz and @tmac87 for giving me his full source code and materials in order to publish everything. So like my Natural Market Combo script, this essentially take his Natural Stochastic Indicator and his Natural Directional Index to create his own average of both indicators. Like the market combo indicator, I created a fix to address the errors in his original script and included both strong and normal buy and sell signals. Strong signals are darker in color and normal signals are lighter in color. Buy when the line turns green and sell when it turns red.
Let me know if there are any other scripts you would like to see me publish!

ADX / RSI Strategy by Trade Rush (created by SirPoggy) This is one of many new strategies coming soon which were seen on Trade Rush
This one is the ADX / RSI Strategy seen here:
https:www.youtube.com/watch?v=uSkGE0ujyn4
While the strategy has been modified slightly to use the DMI instead of the ADX, the core of the strategy is essentially the same
Long signals are generated when the RSI is above 70, close is above the 200EMA, and the ADX is above 25 (added is the plus DMI over 25 and minus DMI below 20)
Stop loss is placed below /above the 21 EMA, however, there is a deviation required to ensure price is not too close to where a stop loss would be placed.
Short signals are generated when the RSI is below 30, close is below the 200EMA, and the ADX is above 25 (added is the minus DMI over 25 and plus DMI below 20)
I do not recommend using this strategy but I have provided this code for educational purposes.
Thanks!
Let me know which strategy you'd like coded next in the comments below.

Natural Directional Index [CC]The Natural Directional Index was created by Jim Sloman and this is another indicator that I'm publishing from the collection of Ocean indicators. I want to make sure his legacy is covered by as many eyes as possible. This is his version of the directional index indicator but he uses his weighting method to use the square root of time and you can see that the signals are very smooth. Big thanks of course to @altcoinz and @tmac87 for helping me get the full source code and files for all of his work. This indicator captures the current trend and I have used my strong buy and sell signals to let you know the strength of the current trend. Darker colors are for strong signals and lighter colors are for normal ones. Buy when the line turns green and sell when it turns red.
Let me know if there are any other indicators you would like to see me publish!

Bollinger Bands + ADX Strategy// This strategy uses Bollinger Bands to buy when the price
// crosses over the lower band and sell when it crosses down
// the upper band. It only takes trades when the ADX is
// below a certain level, and exits all trades when it's above it.

ADX + RSI Strat// This is a strategy that uses the 7 Period RSI to buy when the indicator is shown as oversold (OS) and sells when
// the index marks overbought (OB). It also uses the ADX to determine whether the trend is ranging or trending
// and filters out the trending trades. Seems to work better for automated trading when the logic is inversed (buying OB
// and selling the OS) wihout stop loss.

VWMA with kNN Machine Learning: MFI/ADXThis is an experimental strategy that uses a Volume-weighted MA (VWMA) crossing together with Machine Learning kNN filter that uses ADX and MFI to predict, whether the signal is useful. k-nearest neighbours (kNN) is one of the simplest Machine Learning classification algorithms: it puts input parameters in a multidimensional space, and then when a new set of parameters are given, it makes a prediction based on plurality vote of its k neighbours.
Money Flow Index (MFI) is an oscillator similar to RSI, but with volume taken into account. Average Directional Index (ADX) is an indicator of trend strength. By putting them together on two-dimensional space and checking, whether nearby values have indicated a strong uptrend or downtrend, we hope to filter out bad signals from the MA crossing strategy.
This is an experiment, so any feedback would be appreciated. It was tested on BTC/USDT pair on 5 minute timeframe. I am planning to expand this strategy in the future to include more moving averages and filters.

SADX+DI - Smoothed Average Directional Index by CrypTauxThis script is based on ADX/DI and I use it to enter when trend is in early stage, then ride it & exit at the right time (that's the theory)
ADX is shown as histogram :
- light silver bars = price is under thresold but still no trend, be patient.
- strong gray bars = prepare to enter the trade soon
- blue bars = price momentum so ride the trend
- yellow bars = do not trade (price reverts or consolidates)
Background color/bottom area based on DI+/DI- :
- green = uptrend
- red = downtrend
Top pink triangles appears when ADX is relatively low based on "lookback" history (not based on previous static threshold) so a new trend may happens so stay alerts.
- Prepare for enter when bars turn dark gray and/or pink triangles appears.
- Enter position as soon as you see blue bar (Long or Short as indicated by the area color)
- and Exit on first yellow bar.
Quite simple, works on multiple HTF/LTF and might be used with graphical analysis to find best opportunities.
Enjoy :)
--
Version 35.
RSIADX COMBO Pub VERSIONIts a combination of RSI and ADX for better trend direction . Along with Atr is included as 2nd confirmation of trend , RSiADX with bullish and bearish zones along with HMA and EMA and Divergence for trend trading. Support and Resistance is too added which you can hide according to your need .
Entry rules :
Look for OB(+10) and OS (-10)area along with hma crossover or crossunder of support and resistance .. !
----------------
Disclaimer
Copyright by FaizanNawazz.
The information contained in my scripts/indicators/strategies/ideas does not constitute financial advice or a solicitation to buy or sell any securities of any type. I will not accept liability for any loss or damage, including without limitation any loss of profit, which may arise directly or indirectly from the use of or reliance on such information.
All investments involve risk, and the past performance of a security, industry, sector, market, financial product, trading strategy, or individual’s trading does not guarantee future results or returns. Investors are fully responsible for any investment decisions they make. Such decisions should be based solely on an evaluation of their financial circumstances, investment objectives, risk tolerance, and liquidity needs.
My scripts/indicators are only for educational purposes!
Happy Trading!
ADX Triple - Average Directional Movement Index - TradingEDThis case study is based on a previous ADX + DM study, but with three different counts to compare different trends. The use of this indicator is restricted to private use, and it can be used only by invitation. Different functionalities have been added to the original code, such as alerts and signals that seek to make trading much easier to interpret by any type of trading operator of any experience level, from beginner to intermediate and advanced.
Key components of the original indicator:
• The DIRECTIONAL MOVEMENT INDEX (DMI) is a technical indicator that measures both the strength and direction of a price movement and is intended to reduce false signals.
• The DMI uses two standard indicators, one negative (-DI) and one positive (+DI), in conjunction with a third, the AVERAGE DIRECTIONAL INDEX (ADX), which is non-directional but shows momentum.
• The larger the spread between the two primary lines, the stronger the price trend. If +DI is way above -DI the price trend is strongly up. If -DI is way above +DI then the price trend is strongly down.
• ADX measures the strength of the trend, either up or down; a reading above 20 indicates a strong trend.
ADX is plotted as a single line with values ranging from a low of zero to a high of 100. ADX is non-directional; it registers trend strength whether price is trending up or down. The indicator is usually plotted in the same window as the two DMI lines, from which ADX is derived. When +DI is above -DI , there is more upward pressure than downward pressure in the price. Conversely, if -DI is above +DI , then there is more downward pressure on the price. This indicator may help traders assess the trend direction. Crossovers between the lines are also sometimes used as trade signals to buy or sell, theay are the main trade signals. A long trade is taken when the +DI crosses above the -DI and an uptrend could be underway. Meanwhile, a sell signal occurs when the +DI instead crosses below the -DI .
Main functions of this modified indicator:
1) You can select the type of MOVING AVERAGE , among many available options (SMA, EMA, DEMA, HMA, etc.)
2) The SOURCE for the counts can be determined by the trader (close, open, etc).
3) The MEASURE can be based on a CANDLES count if you are trading OHLC Charts from 1D onwards , or if your trading is intraday, you can also select counts by MINUTES , HOURS or DAYS , depending on your trading style.
4) LENGTH , by default it will be loaded as in the STRATEGY , but considering the previous point, you can modify it according to your convenience.
5) You have the option to hide or show a LABEL at the top of the chart, with respect to the signals: BULLISH green, BEARISH red.
Main performance functions of this modified indicator:
I) In the case of the PERFORMANCE that appears at the right of the chart, you have the option to adjust the WIDTH of each box.
II) The TEXT of the PERFORMANCE is not modifiable, but you can customize the default color. *
III) The BACKGROUND of the PERFORMANCE , you can customize the default color. *
IV) You have the option to hide or show a PERFORMANCE that appears at the right of the chart.
Main functions to customize the style of this indicator:
a) You can select the color for ADX and for DMI , with the colors that best suit you.
b) The CROSSOVER/CROSSUNDER signal between DI+ and DI- can also be customized. *
c) For any type of SIGNAL , it is painted as a VERTICAL LINE in the graph, you can change the color that comes by default. *
d) In the case of the LABELS that appear at the top, the text is not modifiable, but you can customize both the type of label and change the default color. *
e) You can select the colors for the BACKGROUND of the indicator according to the trend, whether it is BEARISH or BULLISH , with the colors that best suit you. *
* By default, they are marked as red for downtrends and green for uptrends.

KINSKI ADXThis ADX indicator (Average Directional Index) tries to estimate the strength of a trend. The Average Directional Index is derived from the positive (+DI) and the negative directional indicator (-DI). The direction of movement is determined by comparing the highs and lows of the current and past periods.
As soon as the indicator determines a trend strength for upward or downward trend, a label is displayed. An upward trend is labelled "Bullish Trend". The downward trend bears the label "Bearish Trend".
The clouds in the background represent the movements of the Average Directional Index High/Low:
Color orange: neutral, uncertain in which direction it is going.
Color green: upward trend
Color red: downward trend
The line represents the average value of the ADX signal:
Color orange: neutral: still uncertain in which direction it is going
Color green / outgoing line: upward trend
Color green / descending line: weakening upward trend
Color red / exiting line: downward trend
Color red / descending line: weakening downward trend
The following configurable options are possible:
"ADX Smoothing
Directional Index Length
Level Range
Level Trend

Bollinger Band + RSI + ADX + MACD + HeikinashiThis script takes into picture Bollinger Bands, RSI with a comparator value, ADX with a comparator value, and MACD with Heikinashi Direction
THIS IS A LONG-ONLY STRATEGY. SHORT TRADES ARE NOT INCLUDED
Strategy:
The Strategy takes a trade only after ALL the following conditions are met.
Candle low is lower than the Bollinger Lower band
RSI is higher than the comparator value
ADX is higher than the comparator value
MACD value is higher than the Signal value
Stop Loss : Max of (Low of the candle - 0.22% and Close of the candle - 0.32%) - FYI, because its max, it's lower of the 2 and your risk is lesser
Target : Max of (Bollinger Band Upper band and 0.75% of the value of underlying) - FYI, it takes the maximum available

Tradelivio's Ranging vs Trending Indicator ADXThis indicator is based on ADX and helps identify if a market is ranging/consolidating or trending.
Default setting are as follows:
0-15 Absent Trend
15-25 Weak Trend
25+ Strong Trend
FYI:
50-75 Very Strong Trend
75-100 Extremely Strong Trend
You can configure 3 levels of strength (Absent, Weak & Strong)
Please keep in mind that a falling ADX line only means that the trend strength is weakening, and it usually does not mean the trend is reversing, unless there has been a price climax.
