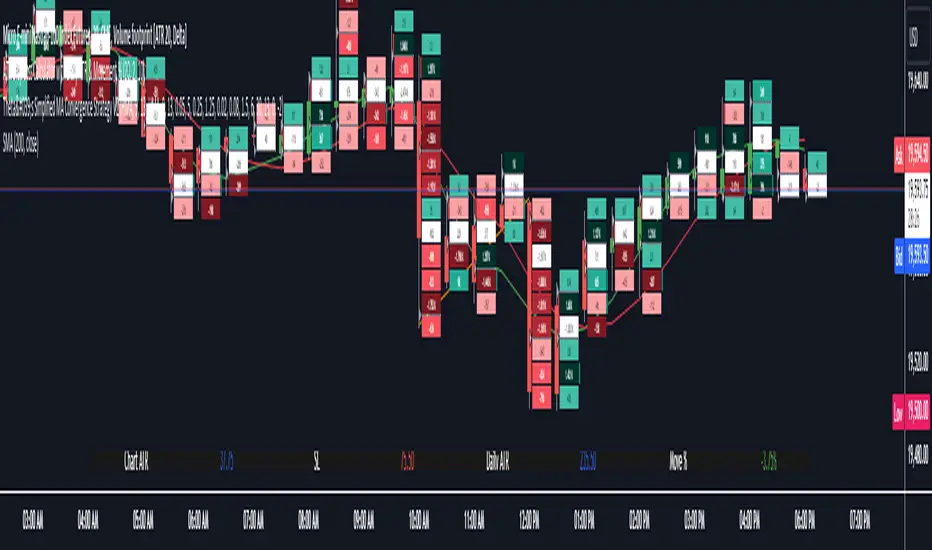
Scalping System by Machine# Custom Trading System Indicator
This Pine Script indicator is designed to identify potential trading setups based on a specific set of rules. It's intended for use on lower timeframes (M1-M5) in the forex market, particularly during the New York-London overlap period.
## Key Features
1. **EMA Condition**: Uses a 20-period Exponential Moving Average (EMA) to determine trend direction.
2. **Candle Analysis**: Identifies strong bars and candle color changes.
3. **Volume Confirmation**: Checks for increasing volume.
4. **Volatility Filter**: Utilizes the Average True Range (ATR) to gauge market volatility.
5. **Time-based Filter**: Highlights the New York-London overlap period.
6. **Visual Aids**: Plots potential entry points, stop losses, and take profit levels.
## Trading Rules
1. **Buy Signal**:
- Price is above the 20 EMA
- Candle color changes from red to green
- Current candle is a strong bar (closing within 75% of its range)
- Volume is higher than the previous bar
- ATR(14) is above 4 pips OR it's during the NY-London overlap
2. **Sell Signal**:
- Price is below the 20 EMA
- Candle color changes from green to red
- Current candle is a strong bar (closing within 75% of its range)
- Volume is higher than the previous bar
- ATR(14) is above 4 pips OR it's during the NY-London overlap
3. **Stop Loss**: Placed near the low of the setup candle for buys, or near the high for sells.
4. **Take Profit**: Aimed at 1R (one times the range of the setup candle).
## Visual Elements
- **20 EMA**: Plotted as a blue line on the chart.
- **Buy Signals**: Green triangles below the candles.
- **Sell Signals**: Red triangles above the candles.
- **Stop Loss Levels**: Small red dots at the calculated stop loss prices.
- **Take Profit Levels**: Small green dots at the calculated take profit prices.
- **Information Table**: Displays current values for ATR, strong bar condition and volume condition.
## Usage Notes
1. This indicator is designed for manual trading, not automated execution.
2. It works best when combined with analysis of major trend lines, support, and resistance levels.
3. Exercise caution with very large setup candles.
4. Consider additional filters or money management rules for enhanced performance.
5. For higher timeframe bias validation, consider incorporating a 100-period break of structure (BOS) analysis.
## Customization
The indicator includes several input parameters that can be adjusted:
- EMA Length
- ATR Length and Threshold
- Volume Multiplier
- Strong Bar Percentage
Users can also toggle the visibility of stop loss and take profit markers.
Remember, while this indicator can identify potential setups, it should be used in conjunction with other forms of analysis and risk management strategies. Always consider the overall market context and your personal risk tolerance when making trading decisions.
טווח ממוצע אמיתי (ATR)

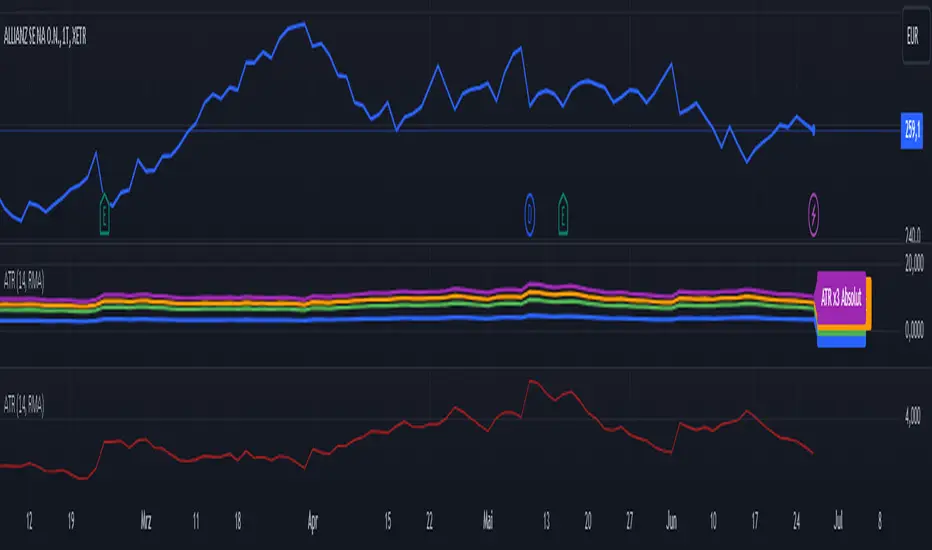
ATR (Average True Range) mit relative/absolute Zahlen GERMAN:
Schnelle Zusammenfassung:
Dieses Skript basiert auf dem ATR-Indikator und wurde so angepasst, dass sowohl relative (%) als auch absolute Zahlen angezeigt werden. Es bietet eine Darstellung des ATR in absoluten und prozentualen Werten sowie multipliziert mit den Faktoren x2, x2.5 und x3. Diese Darstellung erleichtert die Festlegung von Stop-Kursen, insbesondere für Trailing Stops und Trailing Abstände.
Periode:
Die Periode ist einstellbar und definiert die Länge der Berechnung des ATR (Standardwert: 14).
Glättung: Es stehen verschiedene Methoden zur Auswahl, um die Daten zu glätten (RMA, SMA, EMA, WMA).
Berechnungen:
ATR (Absolute Zahl): Berechnung der durchschnittlichen wahren Reichweite (ATR) unter Verwendung der ausgewählten Glättungsmethode und Periode.
ATR (Prozentualer Wert): Berechnung des ATR als Prozentsatz des aktuellen Schlusskurses.
Multiplikation des ATR: Berechnung des ATR multipliziert mit den Faktoren 2, 2.5 und 3 zur Einschätzung verschiedener Handelsszenarien.
Darstellung:
Absoluter ATR-Wert: Darstellung der absoluten ATR-Werte in Blau.
Relative ATR-Werte (%): Darstellung der prozentualen ATR-Werte, ohne Linie in der Grafik (transparent).
Multiplizierte ATR-Werte (x2, x2.5, x3): Darstellung der multiplizierten ATR-Werte in den Farben Grün (x2), Orange (x2.5) und Lila (x3).
Textbeschriftungen: Für jeden absoluten ATR-Wert und seine Multiplikationen werden Textbeschriftungen links im Chart angezeigt.
Verwendung des Indikators:
Dieser Indikator unterstützt Trader und Analysten dabei, die durchschnittliche wahre Reichweite (ATR) eines Finanzinstruments zu verstehen und zu visualisieren. Die verschiedenen Multiplikationen des ATR ermöglichen es, potenzielle Preisbewegungen zu analysieren und Handelsstrategien zu entwickeln, die auf der Volatilität basieren.
Hinweis:
Dies ist meine persönliche Meinung und Einstellung. Dieses Skript stellt keine Bankberatung oder Anlageempfehlung dar. Die Nutzung erfolgt auf eigenes Risiko und Verantwortung des Nutzers.
----------------------------------------------------------------------
ENGLISH:
Quick Summary:
This script is based on the ATR (Average True Range) indicator and has been modified to display both relative (%) and absolute values. It provides a representation of ATR in absolute and percentage terms, as well as multiplied by factors x2, x2.5, and x3. This visualization aids in setting stop-loss levels, especially for trailing stops and trailing distances.
Period:
The period is adjustable and defines the length of the ATR calculation (default: 14).
Smoothing: Various methods are available to smooth the data (RMA, SMA, EMA, WMA).
Calculations:
ATR (Absolute Value): Computes the Average True Range using the selected smoothing method and period.
ATR (Percentage Value): Calculates the ATR as a percentage of the current closing price.
Multiplication of ATR: Computes the ATR multiplied by factors 2, 2.5, and 3 to assess different trading scenarios.
Visualization:
Absolute ATR Value: Displays the absolute ATR values in blue.
Relative ATR Values (%): Shows the ATR values as percentages, without lines in the chart (transparent).
Multiplied ATR Values (x2, x2.5, x3): Presents the multiplied ATR values in green (x2), orange (x2.5), and purple (x3).
Text Labels: Text labels are shown on the left side of the chart for each absolute ATR value and its multiples.
Use of the Indicator:
This indicator helps traders and analysts understand and visualize the Average True Range (ATR) of a financial instrument. The different multipliers of ATR allow for the analysis of potential price movements and the development of trading strategies based on volatility.
Disclaimer:
This represents my personal opinion and viewpoint. This script does not constitute bank advice or investment recommendations. Use it at your own risk and responsibility.
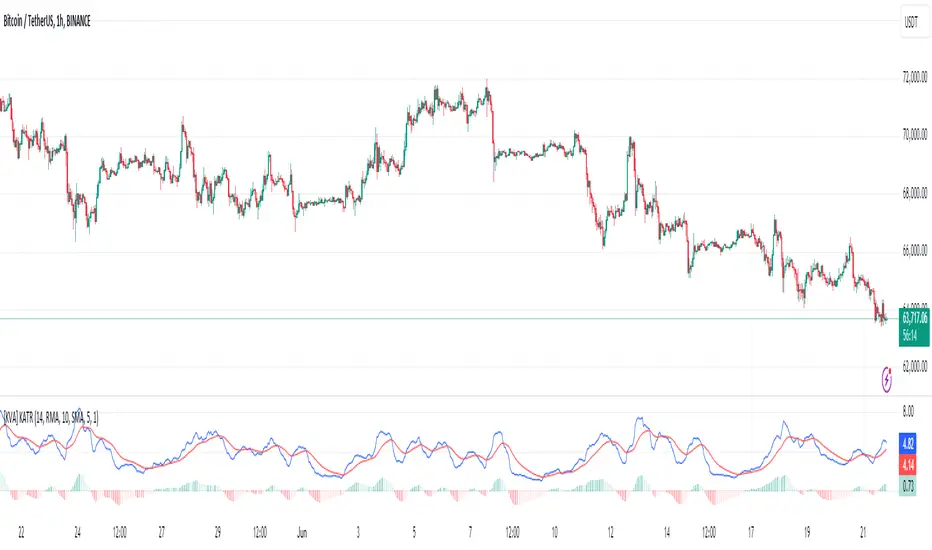
[KVA] KATRThe KATR indicator enhances the traditional ATR by leveraging the most common candle body percentage range, tailoring volatility measurement to specific market contexts. This advanced tool provides more relevant insights tailored to current market conditions.
Key Features:
Configurable ATR Length : Allows users to set the period for the ATR calculation, providing flexibility to adapt to different trading strategies and timeframes.
Multiple Smoothing Options : Offers a choice of RMA, SMA, EMA, and WMA for smoothing the ATR, enabling traders to select the method that best suits their analysis style.
Histogram Visualization for ATR Differences: The histogram visually represents the difference between the ATR and its moving average. This difference, or "dif," is calculated and smoothed, then multiplied by a user-defined factor. The histogram color indicates market conditions:
Light Red: Increasing but below zero, signaling potential weakening.
Light Green: Increasing and above zero, indicating strengthening.
Dark Green: Decreasing but above zero, showing potential weakening.
Dark Red: Decreasing and below zero, indicating strong weakening.
Ideal for Traders:
This indicator is perfect for traders seeking precise, context-sensitive volatility assessments to optimize trade timing and risk management strategies. Integrated seamlessly with other technical indicators, the KATR enhances your trading dashboard by adding depth to volatility analysis.
Detailed Explanation:
ATR Calculation: The ATR is derived by taking the average true range over a specified period, multiplied by the most common body percentage found in historical data.
Smoothing: Users can smooth the ATR using different methods, adding flexibility and customization to suit various trading styles.
Histogram: The histogram's primary function is to visualize the difference between the current ATR and its smoothed average. This provides clear, visual signals for potential volatility expansions or contractions, aiding in better decision-making.
Whether you're a day trader or a long-term investor, the KATR helps you stay ahead of market trends with reliable and easy-to-interpret insights. Elevate your trading strategy with the KATR's innovative approach to volatility measurement.
ATR by Time [QuantVue]"ATR by Time" incorporates time-specific volatility patterns by calculating the Average True Range (ATR) over a customizable period and comparing it to historical ATR values
at specific times of the day.
The Average True Range (ATR) is a popular technical indicator that measures market volatility by decomposing the entire range of an asset price for that period.
By taking the ATR at certain times of the day and comparing it to the current bar's ATR, traders can gain several potential advantages:
Volatility Pattern Recognition: Different times of the trading day often exhibit different levels of volatility. For instance, markets might be more volatile at the open and close compared to midday. By tracking ATR at specific times, traders can recognize these patterns and better predict periods of high or low volatility.
Risk Management: Understanding volatility trends throughout the day helps in better risk management. During periods of high expected volatility (indicated by higher ATR compared to the historical average), traders can adjust their stop-loss levels and position sizes accordingly to protect their capital.
Trend Confirmation and Divergence: This indicator can help confirm trends or identify potential reversals. For example, if the current ATR consistently exceeds the average ATR at specific times, it may confirm a strong trend. Conversely, if the current ATR falls below the historical average, it could signal a potential slowdown or reversal.
This indicator will work on all markets on all time frames. User can customize ATR length as well as the lookback period.
This script utilizes TradingView's RelativeValue library and averageAtTime function, which is used to compare a current data point in a time interval to an average of data points with corresponding time offsets across historical periods. Its purpose is to assess the significance of a value by considering the historical context within past time intervals.
Give this indicator a BOOST and COMMENT your thoughts!
We hope you enjoy.
Cheers!

Supertrend Alert with Arrows and Time FilterOverview
This script is designed to generate trading signals based on the Supertrend indicator, a popular technical analysis tool. The Supertrend indicator is used to identify the direction of the market trend and potential reversal points.
Supertrend Settings
The script uses two sets of Supertrend settings:
Small Supertrend
Factor: 3.0
ATR Period: 10
Big Supertrend
Factor: 10.0
ATR Period: 30
These settings are fixed and should not be altered to maintain the integrity of the signal generation process.
Configurable Parameters
startHour: The hour at which signal generation begins.
endHour: The hour at which signal generation ends.
These parameters allow users to focus on specific trading hours, optimizing the signal relevance to their trading strategy.
Signal Types
The script generates two types of signals:
Type 1: Reversal Signal
Long Signal: Triggered when the big Supertrend is in an uptrend, and the small Supertrend transitions from a downtrend to an uptrend.
Short Signal: Triggered when the big Supertrend is in a downtrend, and the small Supertrend transitions from an uptrend to a downtrend.
Type 2: Trend Change Signal
Long Signal: Triggered when the big Supertrend changes from a downtrend to an uptrend.
Short Signal: Triggered when the big Supertrend changes from an uptrend to a downtrend.
How the Script Works
Initialization: The script initializes with predefined Supertrend settings.
Data Input: Market data (e.g., price data) is fed into the script.
Supertrend Calculation: The script calculates the Supertrend values using the predefined factors and ATR periods.
Signal Detection: The script monitors the Supertrend values and detects the defined signals based on the conditions mentioned above.
Time Filtering: Signals are filtered based on the specified startHour and endHour, ensuring only relevant signals are displayed within the desired timeframe.
Usage
Set Parameters: Define startHour and endHour according to your trading schedule.
Run Script: Execute the script with market data input.
Interpret Signals: Monitor the generated signals and use them to inform your trading decisions.
Originality
Dual Supertrend Usage: The use of both a small and a big Supertrend to generate signals adds a layer of complexity and reliability to the signals.
Time-Based Filtering: Allows traders to focus on specific trading hours, enhancing the relevance and accuracy of signals.
Two Signal Types: The combination of reversal signals and trend change signals provides comprehensive market insights.
Conclusion
This Supertrend Signal Generator is a robust tool for traders seeking to leverage the Supertrend indicator for more informed trading decisions. By combining dual Supertrend settings and configurable trading hours, the script offers unique and flexible signal generation capabilities.

ATR Price Range Prediction V.2### ATR Price Range Prediction V.2
This script calculates the expected high and low prices for the current day based on the Average True Range (ATR) and displays the proportion of days where the daily range (high - low) is greater than or equal to the ATR. Additionally, the script provides an option to adjust the size of the text displayed in the top-right corner of the chart.
#### How It Works
1. **ATR Calculation**: The script calculates the ATR for a specified period (`atrPeriod`). ATR is a measure of volatility that represents the average range between the high and low prices over a specified number of periods.
2. **Expected High and Low Calculation**:
- **Expected High**: Calculated by adding the ATR value to the low price of the current day.
- **Expected Low**: Calculated by subtracting the ATR value from the high price of the current day.
3. **Proportion Calculation**: The script calculates the proportion of days where the daily range (high - low) is greater than or equal to the ATR value. This proportion is updated in real-time as new data comes in.
4. **Table Display**: Instead of displaying labels on each candle, the script shows the expected high, expected low, and the calculated proportion in a table located at the top-right corner of the chart. The size of the text in this table can be adjusted using the `Table Size` input.
5. **Color Coding**: The script changes the color of the bars to yellow if the daily range is greater than or equal to the ATR value, making it easy to identify these bars visually.
#### How to Use
- **ATR Period (`atrPeriod`)**: Adjust the period for the ATR calculation using the input parameter. The default value is 14.
- **Table Size (`tableSizeOption`)**: Choose the size of the text displayed in the table. Options include `tiny`, `small`, `normal`, `large`, and `huge`.
- **Expected High and Low**: Use the green and red lines to identify potential target prices or stop-loss levels for your trades. The green line represents the expected high, and the red line represents the expected low.
- **Proportion**: The table in the top-right corner of the chart shows the proportion of days where the daily range is greater than or equal to the ATR value. This can provide insight into the volatility of the asset.
- **Color Coding**: Yellow bars indicate days where the daily range is greater than or equal to the ATR value.
---
### ภาษาไทย
### ATR คาดการณ์ราคาสูงสุดและต่ำสุด พร้อมสัดส่วน
สคริปต์นี้คำนวณราคาสูงสุดและต่ำสุดที่คาดการณ์สำหรับวันปัจจุบันโดยอิงจากค่าเฉลี่ยช่วงที่แท้จริง (ATR) และแสดงสัดส่วนของวันที่ช่วงราคาต่อวัน (สูง - ต่ำ) มากกว่าหรือเท่ากับค่า ATR นอกจากนี้ยังมีตัวเลือกในการปรับขนาดข้อความที่แสดงในกล่องข้อความมุมขวาบนของกราฟ
#### วิธีการทำงาน
1. **การคำนวณ ATR**: สคริปต์คำนวณค่า ATR สำหรับช่วงเวลาที่กำหนด (`atrPeriod`) ATR เป็นมาตรวัดความผันผวนที่แสดงช่วงเฉลี่ยระหว่างราคาสูงสุดและต่ำสุดในช่วงเวลาที่กำหนด
2. **การคำนวณราคาสูงสุดและต่ำสุดที่คาดการณ์**:
- **ราคาสูงสุดที่คาดการณ์**: คำนวณโดยการบวกค่า ATR กับราคาต่ำสุดของวันปัจจุบัน
- **ราคาต่ำสุดที่คาดการณ์**: คำนวณโดยการลบค่า ATR จากราคาสูงสุดของวันปัจจุบัน
3. **การคำนวณสัดส่วน**: สคริปต์คำนวณสัดส่วนของวันที่ช่วงราคาต่อวัน (สูง - ต่ำ) มากกว่าหรือเท่ากับค่า ATR สัดส่วนนี้จะอัปเดตแบบเรียลไทม์เมื่อมีข้อมูลใหม่เข้ามา
4. **การแสดงผลในตาราง**: แทนที่จะแสดงป้ายกำกับบนแท่งเทียนแต่ละแท่ง สคริปต์จะแสดงราคาสูงสุดที่คาดการณ์ ราคาต่ำสุดที่คาดการณ์ และสัดส่วนที่คำนวณในตารางที่มุมขวาบนของกราฟ โดยสามารถปรับขนาดข้อความในตารางได้
5. **การใช้สี**: สคริปต์จะเปลี่ยนสีของแท่งเทียนเป็นสีเหลืองหากช่วงราคาต่อวันมากกว่าหรือเท่ากับค่า ATR ทำให้สามารถระบุแท่งเทียนเหล่านี้ได้ง่ายขึ้น
#### วิธีการใช้งาน
- **ATR Period (`atrPeriod`)**: ปรับช่วงเวลาสำหรับการคำนวณ ATR โดยใช้พารามิเตอร์การป้อนค่า ค่าเริ่มต้นคือ 14
- **Table Size (`tableSizeOption`)**: เลือกขนาดข้อความที่แสดงในตาราง ตัวเลือกได้แก่ `tiny`, `small`, `normal`, `large`, และ `huge`
- **ราคาสูงสุดและต่ำสุดที่คาดการณ์**: ใช้เส้นสีเขียวและสีแดงเพื่อระบุราคาที่เป็นเป้าหมายหรือระดับการหยุดขาดทุนสำหรับการซื้อขายของคุณ เส้นสีเขียวแสดงถึงราคาสูงสุดที่คาดการณ์และเส้นสีแดงแสดงถึงราคาต่ำสุดที่คาดการณ์
- **สัดส่วน**: ตารางที่มุมขวาบนของกราฟแสดงสัดส่วนของวันที่ช่วงราคาต่อวันมากกว่าหรือเท่ากับค่า ATR ซึ่งสามารถให้ข้อมูลเชิงลึกเกี่ยวกับความผันผวนของสินทรัพย์
- **การใช้สี**: แท่งเทียนสีเหลืองบ่งบอกถึงวันที่ช่วงราคาต่อวันมากกว่าหรือเท่ากับค่า ATR
_____

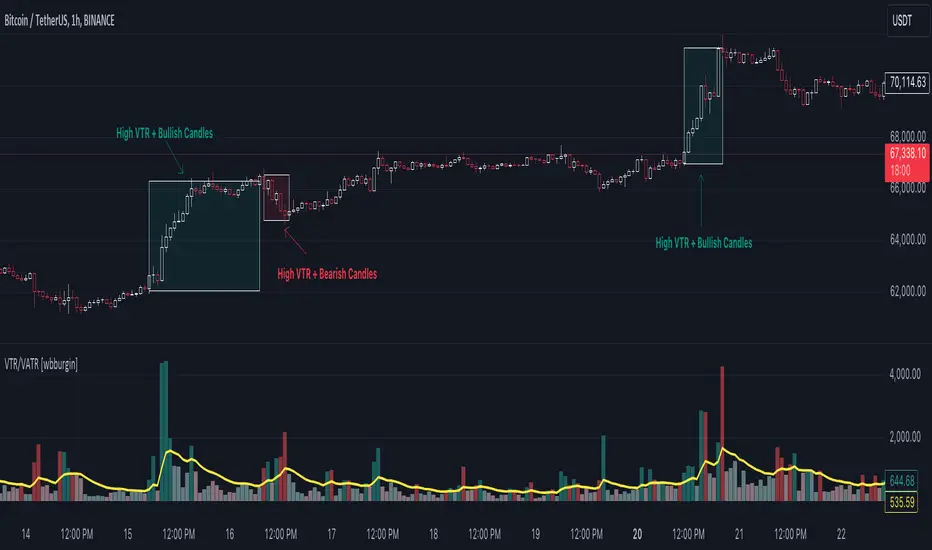
Volume True Range (VTR) and Volume Average True Range (VATR)This indicator uses lower-timeframe cumulative volume delta (CVD) candles to calculate the Volume True Range (VTR) of your instrument. The VTR is calculated similarly to the traditional true range, but uses volume instead (no price is involved in the calculation other than in the lower timeframe bar delta assignments). I haven't seen this concept developed before on TradingView or frankly the Internet, but I thought it seemed fairly intuitive; we can calculate the lower timeframe volume delta candles, so it makes sense to calculate a volume true range, which could show divergences in volume and price.
The VTR is calculated by the following code which uses the lower-timeframe CVD candles:
volumeTR = math.max(cvd_high - cvd_low, math.abs(cvd_high - nz(cvd_close )), math.abs(cvd_low - nz(cvd_close )))
The Volume Average True Range (VATR) is calculated by taking the RMA of the VTR, similarly to the ATR.
I would like to thank TradingView for the calculation of up/down intrabar volumes, which I referenced from their 'CVD - Cumulative Volume Delta Candles' indicator.
How to Use
The VTR and VATR can be used to identify price-volume trends and volatility divergences. A strong VTR (above the VATR of your specified length) can indicate the start or continuation of a trend, which you can identify via the VTR color (determined via price candle colors). Similarly, a rising VATR with most VTR bars of a specific color (green or red) will show that volume is moving in a specific price direction.
Additionally, the VATR plotted next to the ATR of the same length will show you volume volatility divergences. A strong VATR next to a muted/flat ATR indicates strong volume movement, which price might follow in the upcoming bars. Or, for trend reversals, a decreasing ATR after a strong trend combined with a rising VATR of the opposite trend may show a possible reversal.
Hope you all enjoy this.
-wbburgin
* Quick note: lower timeframe analysis returns only so much data. If you are on a high timeframe and the indicator is showing only a limited amount of bars, raise the lower timeframe (but still keep it below your current timeframe) so that the arrays can return more bars for you.
Trade Exit Calculator [MarketSignalsPro]█ OVERVIEW
This Pine Script calculates a Stop Loss and Take Profit order suggestion based on the Average True Range (ATR). This provides a market generated visual reference for the user to better gauge risk and profit potential for their trades. This is not a trade signal system, it is a tool best used in conjunction with an existing system.
█ FEATURES
Inputs:
stopLossMultiplier and takeProfitMultiplier : These are input parameters that allow the user to adjust the multiplier for calculating stop loss and take profit levels.
longIndicator : This input parameter determines whether the script is calculating levels for a long setup (buy) or a short setup (sell).
Variable Initialization:
Various variables are initialized to manage labels, lines, and calculated stop loss and take profit levels.
ATR (Average True Range) is calculated using a period of 14.
Calculation of Stop Loss and Take Profit:
Depending on the value of longIndicator stop loss and take profit levels are not calculated the same way.
For long setups, stop loss is calculated below the closing price and take profit above, while for short setups, it's the opposite.
The calculation involves multiplying the ATR value by the user-defined multipliers and adding or subtracting from the closing price accordingly.
Plotting Lines:
Lines representing the calculated stop loss, take profit, and entry price are plotted on the chart.
Displaying Labels:
Labels displaying the calculated stop loss, take profit, and entry price are shown on the chart alongside the respective lines.
Updating and Deleting Objects:
Existing lines and labels are updated or deleted to ensure only the most recent levels are displayed on the chart.
Final Output:
The script outputs visual representations of stop loss, take profit, and entry price levels on the chart, providing traders with guidance for risk management and profit-taking strategies based on the volatility of the market.
█ CONCLUSION
In summary, this Pine Script enhances trading strategies by calculating and illustrating stop loss and take profit levels based on the Average True Range indicator, offering traders a structured way to manage risk and profit potential.
█ THANKS
Special thanks to Cryptosnagger for taking the time to build this Pine Script and share it freely with the community.

Volatility ATR Support and Resistance Bands [Quantigenics]Volatility ATR Support and Resistance Bands
The “Volatility ATR Support and Resistance Bands” is a trend visualization tool that uses Average True Range (ATR) to create a dynamic channel around price action, adapting to changes in volatility and offering clear trend indicators. The band direction can indicate trend and the lines can indicate support and resistance levels.
The script works by calculating a series of moving averages from the highest and lowest prices, then applies an ATR-based multiplier to generate a set of bands. These bands expand and contract with the market’s volatility, providing a visual guide to the strength and potential direction of price movements.
How to Trade with Volatility ATR Band:
Identify Trend Direction: When the bands slope upwards, the market is trending upwards, which may be a good opportunity to consider a long position. When the bands slope downward, the market is trending downwards, which could be a sign to sell or short.
Volatility Awareness: The wider the bands, the higher the market volatility. Narrow bands suggest a quieter market, which might indicate consolidation or a potential breakout/breakdown.
Confirm Entries and Exits: Use the bands as dynamic support and resistance; entering trades as the price bounces off the bands and considering exits as it reaches the opposite side or breaches the bands.
Hope you enjoy this script!
Happy trading!

Daily Chart ATR & Movement %This Pine Script, titled "Daily ATR & Movement %," is designed for traders looking to gauge volatility and price movements relative to that volatility directly on their trading chart. The script calculates and displays the Average True Range (ATR) over a 14-day period using daily data, alongside the percentage movement of the current price from the previous day's close, scaled by the ATR. These metrics provide a snapshot of daily volatility and the magnitude of price movements within that context, which can be crucial for making informed trading decisions, especially in markets where volatility is a significant factor.
Key Features:
Daily ATR Calculation: Utilizes the ta.atr(14) function to compute the Average True Range on a daily basis, which measures market volatility by decomposing the entire range of asset prices for that day.
Movement Percentage: The script calculates the movement from yesterday’s closing price to today’s current price as a percentage of the daily ATR. This shows how significant today's price change is relative to the typical daily volatility, which helps in understanding whether the price movement is substantial or trivial.
Customizable Label Display: Traders can customize the display through a user input dropdown menu for label size ("small", "normal", "large", "huge") and a slider for vertical offset. This allows for better visibility and customization based on user preference and screen setup.
Dynamic Label Updates: A label is dynamically updated each bar with the latest ATR value and movement percentage. This ongoing update keeps traders informed in real-time without manual recalculations.
How to Use:
Setup: Apply the indicator to any chart.
Customization: Adjust the label size and vertical position to suit your viewing preference using the script’s input options.
Interpretation: Monitor the displayed ATR value and movement percentage to assess volatility and relative price movements. High percentages could indicate significant moves worth trading, while low percentages suggest minor changes.
This script is particularly useful for traders who rely on volatility-based trading strategies, such as breakout trading, where understanding the context of price movements relative to typical market fluctuations can provide a strategic edge.
ATR Stop Loss Zones [ziksfx]The indicator is a dynamic tool that helps traders identify potential stop-loss levels in trending markets. It calculates the Average True Range (ATR) and uses it to create upper and lower boxes around the closing price. These boxes visually represent potential stop-loss zones for long and short positions.
Originality and Usefulness:
This indicator stands out for its unique ability to dynamically adjust stop-loss zones based on market volatility using the ATR approach. This provides traders with a flexible and adaptable risk management tool that adapts to changing market conditions. By visually representing potential stop-loss levels, taking into account the inherent uncertainty of market movements, the indicator empowers traders to make informed decisions about placing stop loses ONLY in trend markets. This allows them to maximize profit potential while minimizing potential downside risk.
Functionality:
Calculates the ATR based on the closing price.
Creates upper and lower of box by adding and subtracting the ATR multiplied by a predefined multiplier (1.5) to the closing price, then generates dynamic boxes based on the upper and lower ATR values.
Indicator allows traders to choose to display boxes for long, short, or both positions simultaneously.
Enables customization of box colors to suit individual preferences and trading styles.
Can be used as a dynamic trailing stop-loss mechanism.
Long box: Enable or disable the display of box for long positions.
Short box: Enable or disable the display of box for short positions.
Color Long Box: Set the color of the box for long positions.
Color Short Box: Set the color of the box for short positions.
Disclaimer:
This information is for educational purposes only and should not be considered financial advice. Remember that trading involves risk, and you could lose money. Always do your own research and consult with a financial professional before making any investment decisions.

Fibonacci Trend Reversal StrategyIntroduction
This publication introduces the " Fibonacci Retracement Trend Reversal Strategy, " tailored for traders aiming to leverage shifts in market momentum through advanced trend analysis and risk management techniques. This strategy is designed to pinpoint potential reversal points, optimizing trading opportunities.
Overview
The strategy leverages Fibonacci retracement levels derived from @IMBA_TRADER's lance Algo to identify potential trend reversals. It's further enhanced by a method called " Trend Strength Over Time " (TSOT) (by @federalTacos5392b), which utilizes percentile rankings of price action to measure trend strength. This also has implemented Dynamic SL finder by utilizing @veryfid's ATR Stoploss Finder which works pretty well
Indicators:
Fibonacci Retracement Levels : Identifies critical reversal zones at 23.6%, 50%, and 78.6% levels.
TSOT (Trend Strength Over Time) : Employs percentile rankings across various timeframes to gauge the strength and direction of trends, aiding in the confirmation of Fibonacci-based signals.
ATR (Average True Range) : Implements dynamic stop-loss settings for both long and short positions, enhancing trade security.
Strategy Settings :
- Sensitivity: Set default at 18, adjustable for more frequent or sparse signals based on market volatility.
- ATR Stop Loss Finder: Multiplier set at 3.5, applying the ATR value to determine stop losses dynamically.
- ATR Length: Default set to 14 with RMA smoothing.
- TSOT Settings: Hard-coded to identify percentile ranks, with no user-adjustable inputs due to its intrinsic calculation method.
Trade Direction Options : Configurable to support long, short, or both directions, adaptable to the trader's market assessment.
Entry Conditions :
- Long Entry: Triggered when the price surpasses the mid Fibonacci level (50%) with a bullish TSOT signal.
- Short Entry: Activated when the price falls below the mid Fibonacci level with a bearish TSOT indication.
Exit Conditions :
- Employs ATR-based dynamic stop losses, calibrated according to current market volatility, ensuring effective risk management.
Strategy Execution :
- Risk Management: Features adjustable risk-reward settings and enables partial take profits by default to systematically secure gains.
- Position Reversal: Includes an option to reverse positions based on new TSOT signals, improving the strategy's responsiveness to evolving market conditions.
The strategy is optimized for the BYBIT:WIFUSDT.P market on a scalping (5-minute) timeframe, using the default settings outlined above.
I spent a lot of time creating the dynamic exit strategies for partially taking profits and reversing positions so please make use of those and feel free to adjust the settings, tool tips are also provided.
For Developers: this is published as open-sourced code so that developers can learn something especially on dynamic exits and partial take profits!
Good Luck!
Disclaimer
This strategy is shared for educational purposes and must be thoroughly tested under diverse market conditions. Past performance does not guarantee future results. Traders are advised to integrate this strategy with other analytical tools and tailor it to specific market scenarios. I was only sharing what I've crafted while strategizing over a Solana Meme Coin.

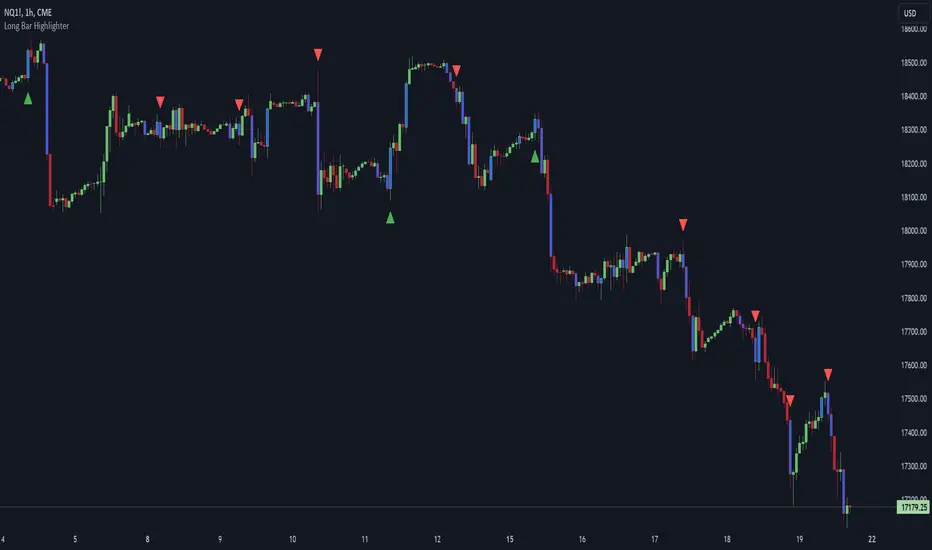
Long Bar Highlighter @shrilssThe Long Bar Highlighter is designed to detect long bars that exhibit significant price expansion beyond recent price levels. It highlights bars that exceed the length of the previous four bars, marking them for their potential importance in market movements. Additionally, the indicator plots directional shapes based on the closing prices, which helps traders visualize potential upward or downward momentum. An optional ATR crossover setting refines these signals, focusing on stronger trends for more optimal trading opportunities.
Best Average Candle SizeThis indicator, named "Best Average Candle Size with Dynamic Midline" (BACS), is designed to provide insights into the average candle size of a financial instrument along with a dynamically adjusting midline. Here's a brief description of its components and functionality:
1. **Average Candle Size**: The indicator calculates the average size of candles over a specified period, which is the absolute difference between the open and close prices. This average candle size is plotted on the chart, helping traders understand the typical price movement within each candle.
2. **Dynamic Midline**: In addition to the average candle size, the indicator computes a dynamic midline. This midline is determined by calculating the moving average of the average candle size over another specified period. The dynamic midline adapts to changes in the average candle size, providing a reference point for assessing deviations from the average.
3. **Volatility Analysis**: The indicator incorporates the Average True Range (ATR) to assess volatility. ATR is plotted alongside the average candle size and the dynamic midline. Traders can compare the average candle size to the ATR to gauge volatility levels. Higher average candle sizes relative to ATR may indicate periods of heightened volatility.
4. **Trend Strength Analysis**: The indicator also evaluates trend strength by comparing the average candle size to its dynamic midline. When the average candle size is above the dynamic midline, it suggests potential trend strength. Traders can use this comparison to assess the strength of price movements and identify potential trend reversal points.
5. **Visualization and Highlighting**: The indicator provides visual representations of the average candle size, dynamic midline, and ATR on the price chart. It also highlights conditions of interest, such as periods of high volatility or strong trend strength, using customizable background colours.
Overall, the "Best Average Candle Size with Dynamic Midline" indicator offers traders a comprehensive view of average candle size dynamics, volatility, and trend strength, aiding in their technical analysis and decision-making processes.

TrendVista Swing IndicatorOverview
The swing indicator is designed to offer traders a comprehensive analysis of market trends and volatility by integrating Bollinger Bands and the Average True Range (ATR). It aids in the visualization of price movements and volatility across multiple time frames, thereby providing insights into potential buy and sell opportunities.
Key Features
- Multitimeframe Analysis : By default, the indicator examines the market across the following time frames: 1 Day (1D), 4 Hours (4H), 1 Hour (1H), and 15 Minutes (15min). Users have the flexibility to modify these time frames to suit their trading strategy by adjusting the indicator's settings.
- Buy and Sell Timings : The indicator identifies optimal buy signals when the price drops below the lower Bollinger Band and subsequently re-enters the band's range. Additionally, a buy signal is generated during high volatility periods—signified by the ATR exceeding its 10-day average—helping traders spot potential liquidation points. Sell signals are tailored for traders looking to exit long positions rather than for initiating short positions.
- Bollinger Bands Phases : The indicator categorizes the market condition into three phases based on Bollinger Bands movement:
- Neutral Phase : When the closing price is within the Bollinger Bands' upper and lower limits.
- Bullish Phase : Signaled by the price closing above the upper Bollinger Band, suggesting an upward trend until the price closes below the middle band.
- Bearish Phase : Initiated when the price closes below the lower Bollinger Band, indicating a downtrend until the price closes above the middle band.
Users can opt to exclude the neutral phase from the analysis through the indicator's settings for a more focused view on bullish or bearish trends.
Indicator Customization
The swing indicator is versatile, allowing users to customize the time frames and phase visibility according to their preferences. This feature ensures that traders can tailor the indicator to match their specific analysis needs and trading strategies.
Considerations
- The signals provided by the swing indicator are not symmetrically designed for both buy and sell actions. The indicator primarily optimizes for identifying long positions, particularly in bull markets. The sell signals are intended for exiting existing long positions rather than for short selling.

Range Finder [UAlgo]🔶 Description:
The "Range Finder " indicator aims at identifying and visualizing price ranges within a specified number of candles. By utilizing the Average True Range (ATR) indicator and Simple Moving Average (SMA), it detects potential breakout conditions and tracks consecutive candles that remain within the breakout range. This indicator offers flexibility by allowing users to customize settings such as range length, method for determining range breaks (based on either candle close or wick), and visualization options for displaying range breaks on the chart.
🔶 Key Features
Identifying Ranges: The Range Finder automatically adapts to the market by continuously evaluating the Average True Range (ATR) and its Simple Moving Average (SMA). This helps in dynamically adjusting the range based on market volatility.
Range Length: Users can specify the number of candles to be used for constructing the range via the "Range Length" input setting. This allows for customization based on trading strategies and preferences.
Range Break Method: The indicator offers the flexibility to choose between two methods for identifying range breaks. Users can select between "Close" or "Wick" based on their preference for using the closing price or the highs and lows (including wicks) of candles for defining the breakout.
Show Range Breaks: This option enables visual representation of range breaks on the chart. When activated, labels with the letter "B" will appear at the breakout point, colored according to the breakout direction (upward breakouts in the chosen up range color and downward breakouts in the chosen down range color).
Range Color Customization: The indicator provides the ability to personalize the visual appearance of the range by selecting preferred colors for ranges indicating potential upward and downward breakouts.
🔶 Disclaimer
It's important to understand that the Range Finder indicator is intended for informational purposes only and should not be solely relied upon for making trading decisions. Trading financial instruments involves inherent risks, and past performance is not necessarily indicative of future results.

ZigZag With ATR Filter [vnhilton](OVERVIEW)
The typical ZigZag indicator, which connects pivot points (see TradingView's Help Center regarding their indicator Pivot Points High Low, for an in depth explanation on how they are calculated) with lines, except instead of a percentage threshold, it uses ATR which adjusts for volatility of the ticker you are viewing. The ZigZag indicator can therefore be used to help visualise price legs and trends on a usually noisy looking chart.
(FEATURES)
- Toggles for pivot point label contents such as the value, the trend, or nothing at all.
- ATR and pivot point periods.
- ATR multiplier minimum threshold to plot pivots and draw lines only when this threshold is met (helps eliminate small, perhaps insignificant price movements, to have a better focus on the overall trend).
- Show the last 2 to 499 ZigZag lines.
- Uptrend, downtrend and range colors for high and low pivot labels, text labels and lines, for both confirmed and real-time plots.
- Label size, and label styles for the high and low pivots.
- Customisable width and styles (Arrow Right, Dashed, Dotted, Solid) for the ZigZag line.
In the main chart picture, labels show both the pivot point value and the trend at that point. In the picture above, on the left shows only the pivot point value, the right shows only the trend.
Picture above shows just the label with 0 contents. Also notice the last recent line being blue instead of green. This is because the current bar hasn't finished so this line is currently live and not confirmed, so is subject to change. Keep in mind even if a pivot point is confirmed, it can be updated by a subsequent higher high/lower low.
Left chart shows a minimum ATR threshold multiplier of 1x; Right chart has 2x ATR minimum threshold. Notice the left chart highlights more price legs as more price legs satisfy a less strict threshold.

SVMKR_UT_Bot_HMA_UCS_LRSThis Pine Script code is a TradingView study script titled "SVMKR_UT_Bot_HMA_UCS_LRS". It combines two separate trading indicators: the UT Bot (Ultimate Trailing Stop Bot) and the UCS_LRS (Linear Regression Slope) indicator.
UT Bot (Ultimate Trailing Stop Bot):
The UT Bot is designed to provide buy and sell signals based on a trailing stop strategy.
It calculates the trailing stop level using the Average True Range (ATR) and Heikin Ashi candle signals if enabled.
Buy signals are generated when the price crosses above the trailing stop, while sell signals occur when the price crosses below the trailing stop.
Additionally, buy and sell signals are visually represented on the chart with corresponding labels and shapes.
The script also includes options to customize the sensitivity of the trailing stop and to color the bars based on buy or sell signals.
Hull Moving Average (HMA):
This section calculates and plots the Hull Moving Average, a type of moving average that reduces lag and improves smoothing compared to traditional moving averages.
It uses the weighted moving average (WMA) to compute the HMA, which helps to identify trend direction and potential reversal points.
UCS_LRS (Linear Regression Slope):
The UCS_LRS indicator calculates the linear regression slope of the closing prices over a specified period.
It then applies exponential smoothing to the slope values and calculates an average slope.
Buy signals are generated when the current slope is greater than the average slope and positive, indicating an uptrend.
Conversely, sell signals are generated when the current slope is less than the average slope and negative, suggesting a downtrend.
The linear regression slope and its average are plotted on the chart, allowing traders to visually identify trend strength and potential reversal points.
Overall, this combined script provides traders with a comprehensive set of tools for trend following and momentum trading strategies, integrating trailing stop analysis, moving average smoothing, and linear regression slope analysis into a single script for technical analysis on TradingView charts.

ATR Bands (Keltner Channel), Wick and SRSI Signals [MW]Introduction
This indicator uses a novel combination of ATR Bands, candle wicks crossing the ATR upper and lower bands, and baseline, and combines them with the Stochastic SRSI oscillator to provide early BUY and SELL signals in uptrends, downtrends, and in ranging price conditions.
How it’s unique
People generally understand Bollinger Bands and Keltner Channels. Buy at the bottom band, sell at the top band. However, because the bands themselves are not static, impulsive moves can render them useless. People also generally understand wicks. Candles with large wicks can represent a change in pattern, or volatile price movement. Combining those two to determine if price is reaching a pivot point is relatively novel. When Stochastic RSI (SRSI) filtering is also added, it becomes a genuinely unique combination that can be used to determine trade entries and exits.
What’s the benefit
The benefit of the indicator is that it can help potentially identify pivots WHEN THEY HAPPEN, and with potentially minimal retracement, depending on the trader’s time window. Many indicators wait for a trend to be established, or wait for a breakout to occur, or have to wait for some form of confirmation. In the interpretation used by this indicator, bands, wicks, and SRSI cycles provide both the signal and confirmation.
It takes into account 3 elements:
Price approaching the upper or lower band or the baseline - MEANING: Price is becoming extended based on calculations that use the candle trading range.
A candle wick of a defined proportion (e.g. wick is 1/2 the size of a full candle OR candle body) crosses a band or baseline, but the body does not cross the band or baseline - MEANING: Buyers and sellers are both very active.
The Stochastic RSI reading is above 80 for SELL signals and below 20 for BUY signals - MEANING: Additional confirmation that price is becoming extended based on the current cyclic price pattern.
How to Use
SIGNALS
Buy Signals - Green(ish):
B Signal - Potential pivot up from the lower band when using the preferred multiplier
B1 Signal - Potential pivot up from the lower band when using phi * multiplier
B2 Signal - Potential pivot up from the lower band when using 1/2 * multiplier
B3 Signal - Potential pivot up from baseline
Sell Signals - Red(ish):
S Signal - Potential pivot down from the upper band when using the preferred multiplier
S1 Signal - Potential pivot down from the upper band when using
S2 Signal - Potential pivot down from the upper band when using 1/2 * multiplier
S3 Signal - Potential pivot down from the baseline
DISCUSSION
During an uptrend or downtrend, signals from the baseline can help traders identify areas where they may enter the trending move with the least amount of drawdown. In both cases, entry points can occur with baseline signals in the direction of the trend.
For example, in an uptrend (when the price is forming higher highs and higher lows, or when the baseline is rising), price tends to oscillate between the upper band and baseline. In this case, the baseline BUY signal (B3) can show an entry point.
In a downtrend (when the price is forming lower highs and lower lows, or when the baseline is falling), price tends to oscillate between the baseline and the lower band. In this case, the baseline SELL signal (S3) can show an entry point.
During consolidation, when price is ranging, price tends to oscillate between the upper and lower bands, while crossing through the baseline unperturbed. Here, entry points can occur at the upper and lower bands.
When all conditions are met at the lower band during consolidation, a BUY signal (B), can occur. This signal may also occur prior to a break out of consolidation to the upside.
When all conditions are met at the upper band during consolidation, a SELL signal (S), can occur. This signal may also occur prior to a break out of consolidation to the downside.
Additional B1, B2, and S1, and S2 signals can be displayed that use the bands based on a multiplier that is half that of the primary one, and phi (0.618) times the primary multiplier as a way to quickly check for signals occurring along different, but related, bands.
Calculations
ATR Bands, or Keltner Channels, are a technical analysis tool that are used to measure market volatility and identify overbought or oversold conditions in the trading of financial instruments, such as stocks, bonds, commodities, and currencies. ATR Bands consist of three lines plotted on a price chart:
Middle Band, Basis, or Baseline: This is typically a simple moving average (SMA) of the closing prices over a certain period. It represents the intermediate-term trend of the asset's price.
Upper Band: This is calculated by adding a certain number of ATRs to the middle band (SMA). The upper band adjusts itself with the increase in volatility.
Lower Band: This is calculated by subtracting the same number of ATRs from the middle band (SMA). Like the upper band, the lower band adjusts to changes in volatility.
The candle wick signals occur if the wick is at the specified ratio compared to either the entire candle or the candle body. The upper band, lower band, and baseline signals happen if the wick is the specified ratio of the total candle size. For the major signals for upper and lower bands, these occur when the wick extends outside of the bands while closing a candle inside of the bands. For the baseline signals, they occur if a wick crosses a baseline but closes on the other side.
Settings
CHANNEL SETTINGS
Baseline EMA Period (Default: 21): Period length of the moving average basis line.
ATR Period (Default: 21): The number of periods over which the Average True Range (ATR) is calculated.
Basis MA Type (Default: SMA): The moving average type for the basis line.
Multiplier (Default: 2.5: The deviation multiplier used to calculate the band distance from the basis line.
ADDITIONAL CHANNELS
Half of Multiplier Offset (Default: True): Toggles the display of the ATR bands that are set a distance of half of the ATR multiplier.
Quarter of Multiplier Offset (Default: false): Toggles the display of the ATR bands that are set a distance of one quarter of the ATR multiplier.
Phi (Φ) Offset (Default: false): Toggles the display of the ATR bands that are set a distance of phi (Φ) times the ATR multiplier.
WICK SETTINGS FOR CANDLE FILTERS
Wick Ratio for Bands (Default: 0.4): The ratio of wick size to total candle size for use at upper and lower bands.
Wick Ratio for Baseline (Default: 0.4): The ratio of wick size to total candle size for use at baseline.
Use Candle Body (rather than full candle size) (Default: false): Determines whether wick calculations use the candle body or the entire candle size.
VISUAL PREFERENCES - SIGNALS
Show Signals (Default: true): Allows signal labels to be shown.
Show Signals from 1/2 Band Offset (Default: false): Toggle signals originating from 1/2 offset upper and lower bands.
Show Signals from Phi (Φ) Band Offset (Default: false): Toggle signals originating from phi (Φ) offset upper and lower bands.
Show Baseline Signals (Default: false): Toggle Baseline signals.
VISUAL PREFERENCES - BANDS
Show ATR (Keltner) Bands (Default: true): Use a background color inside the Bollinger Bands.
Fill Bands (Default: true): Use a background color inside the Bollinger Bands.
STOCHASTIC SETTINGS
Use Stochastic RSI Filtering (Default: False): This will only trigger some SELL signals when the stochastic RSI is above 80, and BUY signals when below 20.
K (Default: 3): The smoothing level for the Stochastic RSI.
RSI Length (Default: 14): The period length for the RSI calculation.
Stochastic Length (Default: 8): The period length over which the stochastic calculation is performed.
Other Usage Notes and Limitations
To understand future price movement, this indicator assumes that 3 things must be known:
Evidence of a change of market structure. This can be demonstrated by increased volatility, consolidation, volume spikes (which can be tracked with the MW Volume Impulse Indicator) or, in the case of this indicator, candle wicks.
The potential cause of the change. It could be a VWAP line (which can be tracked with the Multi VWAP , and Multi VWAP from Gaps indicators), an event, an important support or resistance level, a key moving average, or many other things. This indicator assumes the ATR bands can be a cause.
The current position in the price cycle. Oscillators like the RSI, and MACD, are typical measures of price oscillation (other oscillators like the Price and Volume Stochastic Divergence indicator can also be useful). This indicator uses the Stochastic RSI oscillator to determine overbought and oversold conditions.
When evidence of the change appears, and the potential cause of the change is identified, and the price oscillation is at a favorable position for the desired trading direction, this indicator will generate a signal.
ATR Bands (or Keltner Channels) are used to determine when price might “revert to the mean”. Crossing, or being near the upper or lower band, can indicate an overbought or oversold condition, which could lead to a price reversal. By tracking the behavior of candle wicks during these events, we can see how active the battle is between buyers and sellers.
If the top of a wick is large, it may indicate that sellers are aggressively attempting to bring the price down. Conversely, if the bottom wick is large, it can indicate that buyers are actively trying to counter the price action caused by selling pressure.
When this wicking action occurs at times when price is not near the upper band, lower band, or baseline, it could indicate the presence of an important level. That could mean a nearby VWAP line, a supply or demand zone, a round price number, or a number of other factors. In any case, this wick may be the first indication of a price reversal.
Shorter baseline periods may be better for short period trading like scalping or day trading, while longer period baselines can show signals that are better suited to swing trading, or longer term investing.
It's important for traders to be aware of the limitations of any indicator and to use them as part of a broader, well-rounded trading strategy that includes risk management, fundamental analysis, and other tools that can help with reducing false signals, determining trend direction, and providing additional confirmation for a trade decision. Diversifying strategies and not relying solely on one type of indicator or analysis can help mitigate some of these risks.
The TradingView platform allows a maximum of 500 labels per chart. This means that if your settings allow for a lot of signals, labels for earlier ones may not appear if the total number of labels exceeds 500 for the chart.

Median Supertrend [BackQuant]Median Supertrend Concept by BackQuant ©
This was created since the normal supertrend is noisy, in the attempts to remove that and still get a good signal we decided to use a special median calculation as the source to a modified supertrend. This allows us to reduce noise, and make the supertrend adaptive to volatility. The full description and reasoning, including definitions and backtests are as follows:
1. Definition of Median
The median is a statistical measure that identifies the middle value in a given set of numbers when those numbers are arranged in either ascending or descending order. If the dataset has an even number of observations, the median is calculated as the average of the two middle numbers. This measure is particularly useful in understanding the central tendency of data, especially in cases where the dataset may contain outliers that could skew the mean. For example, in a dataset representing the earnings of families, the median provides a more accurate reflection of the typical income than the mean if the dataset includes extreme values.
2. Understanding Supertrend and Its Use Case
Supertrend is a popular trend-following indicator used in technical analysis. It is computed using the Average True Range (ATR) to capture volatility, combined with a moving average. The indicator provides clear signals to traders about bullish or bearish trends, indicating potential entry and exit points. Traders often use Supertrend in various market conditions to enhance their trading strategies, leveraging its simplicity and effectiveness in identifying ongoing trends and reversals.
3. Rationale Behind Combining Median with Supertrend
The integration of the median into the Supertrend indicator seeks to mitigate the impact of outliers and sudden market spikes that can affect trend analysis. By using the median value of price data for trend determination, the Median Supertrend aims to offer a more stable and reliable indicator that reflects the underlying market conditions more accurately than traditional methods. This modification is intended to improve the timing of trend detection and the precision of entry and exit signals.
4. Key Differences and Benefits
Enhanced Stability: The use of median values reduces sensitivity to extreme price movements, offering a smoother trend line that can lead to more reliable trading signals.
Adaptive Sensitivity: Users can adjust the indicator's sensitivity to align with different trading styles and market conditions through customizable parameters like the ATR multiplier and lookback period.
Explicit Trading Signals: The indicator simplifies the trading process by providing clear, actionable long and short signals based on trend reversals, aiding in decision-making.
Customizability: Options to use Heikin Ashi candles, paint candles based on the trend, and toggle signal visibility allow traders to personalize the indicator to their preference.
5. User Inputs
The Median Supertrend indicator includes several user inputs to tailor its operation:
Use HA Candles as Source?: Option to base calculations on Heikin Ashi candles for smoother price data.
Paint Candles According to Trend?: Visual aid that colors candles based on the current trend direction, enhancing chart readability.
ATR Period and Multiplier: Parameters to adjust the sensitivity of the trend detection, allowing users to fine-tune the indicator.
Adaptive Lookback Period: Defines the period for the median calculation, offering flexibility in trend assessment.
Show Long and Short Signals: Enables traders to visualize entry signals directly on the chart.
6. Application in Trading
Traders can incorporate the Median Supertrend into their strategies as a standalone indicator for trend following or as a filter in a multi-indicator system. It is particularly useful in markets known for having outliers or sudden price jumps, as the median-based calculation provides a grounded trend analysis. This indicator can be applied across various timeframes and asset classes, making it a versatile tool for day traders, swing traders, and long-term investors alike.
7. Summary and Empirical Soundness
The integration of median values into the Supertrend indicator represents an innovative approach to trend analysis, addressing some of the volatility and outlier-related challenges inherent in traditional methods. This combination is empirically sound as it leans on the statistical robustness of the median to offer a more stable and reliable trend determination mechanism.
8. Relavant Backtests on Major Assets (1D Timeframe)
We include these backtests as a general proxy for how they work.
Please do your own calibrating to suit it to your own needs and backtest.
Past results don't = future results but they can help you understand how it functions.
INDEX:BTCUSD
INDEX:ETHUSD
BINANCE:SOLUSD

Shadow Range IndexShadow Range Index (SRI) introduces a new concept to calculate momentum, shadow range.
What is range?
Traditionally, True Range (TR) is the current high minus the current low of each bar in the timeframe. This is often used successfully on its own in indicators, or as a moving average in ATR (Average True Range).
To calculate range, SRI uses an innovative calculation of current bar range that also considers the previous bar. It calculates the difference between its maximum upward and maximum downward values over the number of bars the user chooses (by adjusting ‘Range lookback’).
What is shadow range?
True Range (TR) uses elements in its calculation (the highs and lows of the bar) that are also visible on the chart bars. Shadow range does not, though.
SRI calculates shadow range in a similar formula to range, except that this time it works out the difference between the minimum upward and minimum downward movement. This movement is by its nature less than the maximums, hence a shadow of it. Although more subtle, shadow range is significant, because it is quantifiable, and goes in one direction or another.
Finally, SRI smoothes shadow range and plots it as a histogram, and also smoothes and plots range as a signal line. Useful up and down triangles show trend changes, which optionally colour the chart bars.
Here’s an example of a long trade setup:
In summary, Shadow Range Index identifies and traces maximum and minimum bar range movement both up and down, and plots them as centred oscillators. The dynamics between the two can provide insights into the chart's performance and future direction.
Credit to these authors, whose MA or filters form part of this script:
@balipour - Super Smoother MA
@cheatcountry - Hann window smoothing
@AlgoAlpha - Gaussian filter
ATR Bands with Optional Risk/Reward Colors█ OVERVIEW
This indicator projects ATR bands and, optionally, colors them based on a risk/reward advantage for those who trade breakouts/breakdowns using moving averages as partial or full exit points.
█ DEFINITIONS
► True Range
The True Range is a measure of the volatility of a financial asset and is defined as the maximum difference among one of the following values:
- The high of the current period minus the low of the current period.
- The absolute value of the high of the current period minus the closing price of the previous period.
- The absolute value of the low of the current period minus the closing price of the previous period.
► Average True Range
The Average True Range was developed by J. Welles Wilder Jr. and was introduced in his 1978 book titled "New Concepts in Technical Trading Systems". It is calculated as an average of the true range values over a certain number of periods (usually 14) and is commonly used to measure volatility and set stop-loss and profit targets (1).
For example, if you are looking at a daily chart and you want to calculate the 14-day ATR, you would take the True Range of the previous 14 days, calculate their average, and this would be the ATR for that day. The process is then repeated every day to obtain a series of ATR values over time.
The ATR can be smoothed using different methods, such as the Simple Moving Average (SMA), the Exponential Moving Average (EMA), or others, depending on the user's preferences or analysis needs.
► ATR Bands
The ATR bands are created by adding or subtracting the ATR from a reference point (usually the closing price). This process generates bands around the central point that expand and contract based on market volatility, allowing traders to assess dynamic support and resistance levels and to adapt their trading strategies to current market conditions.
█ INDICATOR
► ATR Bands
The indicator provides all the essential parameters for calculating the ATR: period length, time frame, smoothing method, and multiplier.
It is then possible to choose the reference point from which to create the bands. The most commonly used reference points are Open, High, Low, and Close, but you can also choose the commonly used candle averages: HL2, HLC3, HLCC4, OHLC4. Among these, there is also a less common "OC2", which represents the average of the candle body. Additionally, two parameters have been specifically created for this indicator: Open/Close and High/Low.
With the "Open/Close" parameter, the upper band is calculated from the higher value between Open and Close, while the lower one is calculated from the lower value between Open and Close. In the case of bullish candles, therefore, the Close value is taken as the starting point for the upper band and the Open value for the lower one; conversely, in bearish candles, the Open value is used for the upper band and the Close value for the lower band. This setting can be useful for precautionally generating broader bands when trading with candlesticks like hammers or inverted hammers.
The "High/Low" parameter calculates the upper band starting from the High and the lower band starting from the Low. Among all the available options, this one allows drawing the widest bands.
Other possible options to improve the drawing of ATR bands, aligning them with the price action, are:
• Doji Smoothing: When the current candle is a doji (having the same Open and Close price), the bands assume the values they had on the previous candle. This can be useful to avoid steep fluctuations of the bands themselves.
• Extend to High/Low: Extends the bands to the High or Low values when they exceed the value of the band.
• Round Last Cent: Expands the upper band by one cent if the price ends with x.x9, and the lower band if the price ends with x.x1. This function only works when the asset's tick is 0.01.
► Risk/Reward Advantage
The indicator optionally colors the ATR bands after setting a breakpoint, one or two risk/reward ratios, and a series of moving averages. This function allows you to know in advance whether entering a trade can provide an advantage over the risk. The band is colored when the ratio between the distance from the break point to the band and the distance from the break point to the first available moving average reaches at least the set ratio value. It is possible to set two colorings, one for a minimum risk/reward ratio and one for an optimal risk/reward ratio.
The break point can be chosen between High/Low (High in case of breakout, Low in case of breakdown) or Open/Close (on breakouts, Close with bullish candles or Open with bearish candles; on breakdowns, Close with bearish candles or Open with bullish candles).
It is possible to choose up to 10 moving averages of various types, including the VWAP with the Anchor Period (2).
Depending on the "Price to MA" setting, the bands can be individually or simultaneously colored.
By selecting "Single Direction," the risk/reward calculation is performed only when all moving averages are above or below the break point, resulting in only one band being colored at a time. For this reason, when the break point is in between the moving averages, the calculation is not executed. This setting can be useful for strategies involving price movement from a level towards a series of specific moving averages (for example, in reversals starting from a certain level towards the VWAP with possible partial take profits on some previous moving averages, or simply in trend following towards one or more moving averages).
Choosing "Both Directions" the risk/reward ratio is calculated based on the first available moving averages both above and below the price. This setting is useful for those who operate in range bound markets or simply take advantage of movements between moving averages.
█ NOTE
This script may not be suitable for scalping strategies that require immediate entries due to the inability to know the ATR of a candle in advance until its closure. Once the candle is closed, you should have time to place a stop or stop-limit order, so your strategy should not anticipate an immediate start with the next candle. Even more conveniently, if your strategy involves an entry on a pullback, you can place a limit order at the breakout level.
(1) www.tradingview.com
(2) For convenience, the code for the Anchor Period has been entirely copied from the VWAP code provided by TradingView.

[Spinn] LevelsThis is one of the best and most useful indicators I have ever created. It plots support and resistance levels at pivot points. The purpose of this indicator is to save the trader’s time on drawing levels and automate this routine process.
Support and resistance levels are a cornerstone of trading. Every seasoned trader can plot them on a chart, underscoring their significance for making trading decisions—they're visible to all, indicating areas dense with orders on both sides.
Despite the plethora of level indicators available, many of which are free, I found none that were convenient and fulfilled their intended purpose. Here are the key features and advantages of this indicator, setting it apart from others and deemed critically important:
Only Key Levels *
The main challenge in creating a levels indicator is ensuring only significant, key levels are displayed, avoiding clutter. This indicator achieves this by selectively filtering important levels from the noise and visually distinguishing confirmed levels (solid lines for tested or price-near levels) from unconfirmed (dashed lines for less important ones).
Visible Chart Fragment Only
It displays levels for only the visible part of the chart, avoiding an overload of lines across the entire history.
False Breakouts
Lines persist until a level is breached. Minor false breakouts are ignored.
Target Timeframe
Occasionally, viewing levels from a higher timeframe is necessary. This indicator can do so, highlighting target timeframe levels with thicker lines. It allows viewing levels from both the current and target timeframes simultaneously or just the target timeframe.
By Bodies or By Shadows
The indicator can draw support and resistance levels by both candle bodies and shadows, accommodating strategies based on breaking or bouncing off levels.
Level Price Tags
To avoid searching for the price at which a level is drawn, price tags are immediately visible near all currently relevant levels, simplifying and speeding up routine work.
Alerts
Setting alerts for approaching a level is a key feature. Haven't grasped its awesomeness? Here's why it's a game-changer: Set alerts on your favorite coins for each working timeframe. When the price approaches a level, you'll get a signal. Just open the chart to assess the situation and make a trading decision. This way, you don't waste time flipping through charts, searching for trading setups. Focus on your tasks, and let the indicator signal trading opportunities.
Three types of alerts are available: approaching a support level, a resistance level, or any level.
* Important (key) levels are the levels where the price reverses, or stops and “stomps around” for some time. This indicates that these places are an area of interest for a major seller or buyer. This effect is enhanced since such levels are visible to all market players, which means that even more traders can make trading decisions in these zones.
Three additional features enhance usability:
ATR in the Status Line: The indicator's status line displays four numbers - average price movement in points and percentages for both the current and target timeframes, invaluable for deciding stop and take-profit sizes if you base them on ATR. It works on historical data too—just hover over the desired chart section. Don't forget to enable indicator values display in its status line (right-click the indicator name to access the menu).
Visualize ATR: You can display the average price movement as a dotted line - one ATR up and one down from the current price. This visually indicates how close the price is to a level — whether within its average movement range. If you've enabled levels display for the higher timeframe, the average movement for it is also shown.
You can enable the mode for viewing historical levels. In this mode, when a level appears close to the historical one, a new level will not be drawn, but the historical level will continue. Use this option with caution, as the script will "pull out" too many old levels.
If you're interested in testing how effective this indicator is, send me a private message for free trial access. I believe it's a "must-have" for both beginners and experienced traders.
----------
Это один из самых лучших и полезных индикаторов, которые я когда-либо создавал. Он строит уровни поддержки и сопротивления в точках разворота. Задача данного индикатора - сэкономить время трейдера на прорисовку уровней и автоматизировать этот рутинный процесс.
Уровни поддержки и сопротивления - это одна из основ трейдинга. Каждый опытный трейдер может нарисовать их на графике, и в этом и заключается их важность для принятия торговых решений - их все видят, и все знают, что в зоне этих уровней располагается много ордеров в обе стороны.
Существует огромное количество индикаторов уровней, многие из которых бесплатны. Однако я не нашел ни одного индикатора, который бы был удобен в работе и делал бы именно то, ради чего он и нужен. Вот ключевые особенности и преимущества данного индикатора, которые отличают его от других индикаторов уровней. Я считаю их критически важными:
Только ключевые уровни *
Одна из главных проблем при написании индикатора уровней - как сделать так, чтобы на графике былы отображены только важные, ключевые уровни, и не было ничего лишнего. Данный индикатор делает это двумя способами. Во-первых, он не перегружает график лишними линиями, алгоритм умеет отбирать важные и отсекать шум. А во-вторых, подтвержденные уровни (если был тест или если цена подходила близко к уровню) визуально видны - они рисуются сплошной линией. Неподтвержденные (а значит, менее важные) уровни рисуются пунктиром.
Только видимый фрагмент графика
Показаны уровни лишь для видимого участка графика, а не огромное число линий одновременно для всей истории графика
Ложные пробои
Линии рисуются до того момента, пока уровень не будет пробит. Если происходят небольшие ложные пробои, они игнорируются.
Целевой таймфрейм
Иногда возникает необходимость увидеть уровни со старшего таймфрейма. Индикатор умеет это делать, при этом уровни целевого таймфрейма выделяются более толстыми линиями. Причем вы можете видеть как одновременно уровни с двух таймфреймов - с текущего и целевого, так и только с целевого.
По телам и по теням
Индикатор умеет рисовать уровни поддержки и сопротивления как по теням, так и по телам свечей. То есть, вы сможете применять его как для стратегии работы на пробой уровня, так и для стратегии работы на отбой от уровня.
На какой цене стоит уровень
Чтобы не искать цену, на которой нарисован уровень, вы сразу можете видеть метки с ценами возле всех актуальных на данный момент уровней. Это простая, но очень полезная функция, которая сильно облегчает и ускоряет рутинную работу.
Оповещения
Индикатор позволяет расставить оповещения о приближении к уровню. Это одна из ключевых особенностей индикаторы. Вы еще не поняли, насколько это крутая фишка? Объясняю. Добавляете оповещения на ваших любимых монетах на каждом из рабочих таймфреймов. Когда цена приблизится к одному из уровней, вы получите сигнал об этом. Достаточно будет открыть график и оценить ситуацию, чтобы принять торговое решение. Таким образом, вам не надо тратить время на перебор графиков и проводить часы в поисках торговой ситуации. Занимайтесь своими делами, а сигнал о торговой ситуации вам подаст индикатор.
Для облегчения работы доступны три вида оповещений - цена приближается к уровню поддержки, цена приближается к уровню сопротивления, цена приближается к одному из уровней.
* Важными (ключевыми) уровнями являются уровни, где цена разворачивается, либо останавливается и «топчется» некоторое время. Это свидетельствует о том, что эти места являются зоной интереса крупного продавца или покупателя. Этот эффект усиливается, так как такие уровни видны всем игрокам рынка, а, значит, еще больше трейдеров могут принимать торговые решения в этих зонах.
Я добавил три полезные фишки для удобства работы.
ATR в статусной строке. В статусной строке индикатора отображаются 4 числа - средний ход цены пунктах и в процентах для текущего ТФ, и то же самое для целевого ТФ. Очень удобно для принятия решения о размерах тейка и стопа, если вы привязываете их к ATR. Работает и на истории - просто подведите мышку к нужному участку графика. Не забудьте включить показ значений индикатора в его статусной строке (клик правой кнопкой мышки на названии индикатора вызовет нужное меню).
Можно отобразить средний ход цены пунктирной линией - один ATR вверх от текущей цены, и один ATR вниз. Таким образом, вы визуально сможете определить, насколько близко мы подошли к уровню - находится ли цена от уровня в пределах ее среднего хода, или нет. Если вы включили опцию отображения уровней для старшего ТФ, то будет показан средний ход и для него.
Можно включить режим просмотра исторических уровней. В этом режиме при появлении уровня, близкого к историческому, новый уровень рисоваться не будет, а будет продолжаться исторический уровень. Используйте эту опцию с осторожностью, так как скрипт "вытащит" слишком много старых уровней.
Если вы хотите попробовать, насколько хорош данный индикатор, напишите мне личное сообщение - я предоставлю вам бесплатный тестовый доступ. Я же считаю, что он относится к категории «маст хев» - как для новичков, так и для опытных трейдеров.
