Specter Trend Cloud [ChartPrime]⯁ OVERVIEW
Specter Trend Cloud is a flexible moving-average–based trend tool that builds a colored “cloud” around market direction and highlights key retest opportunities. Using two adaptive MAs (short vs. long), offset by ATR for volatility adjustment, it shades the background with a gradient cloud that switches color on trend flips. When price pulls back to retest the short MA during an active trend, the script plots diamond markers and extends dotted levels from that retest price. If price later breaks through that level, the extension is terminated—giving traders a clean visual of valid vs. invalid retests.
⯁ KEY FEATURES
Multi-MA Core Engine:
Choose from SMA, EMA, SMMA (RMA), WMA, or VWMA as the base. The indicator tracks both a short-term MA (Length) and a longer twin (2 × Length).
Volatility-Adjusted Offset:
Both MAs are shifted by ATR(200) depending on trend direction—pulling them down in uptrends, up in downtrends—so the cloud reflects realistic breathing room instead of razor-thin bands.
Gradient Trend Cloud:
Between the two shifted MAs, the script fills a shaded region:
• Aqua cloud = bullish trend
• Orange cloud = bearish trend
Gradient intensity increases toward the active edge, providing a visual sense of strength.
Trend Flip Logic:
A flip occurs whenever the short MA crosses above or below the long MA. The cloud instantly changes color and begins tracking the new regime.
Retest Detection:
During an ongoing trend (no flip), if price retests the short MA within a 5-bar “cooldown,” the tool:
• Marks the retest with diamond shapes below/above the bar.
• Draws a dotted horizontal line from the retest price, extending into the future.
Automatic Level Termination:
If price later closes through that dotted level, the line disappears—keeping only active, respected retest levels on your chart.
⯁ HOW IT WORKS (UNDER THE HOOD)
MA Calculations:
ma1 = MA(src, Length), ma2 = MA(src, 2 × Length).
Trend = ma1 > ma2 (bull) or ma1 < ma2 (bear).
ATR shift offsets both ma1 and ma2 by ±ATR depending on trend.
Cloud Fill:
Plots ma1 and ma2 (invisible for long MA). Uses fill() with semi-transparent aqua/orange gradient between the two.
Retest Logic:
• Bullish retest: ta.crossover(low, ma1) while trend = bull.
• Bearish retest: ta.crossunder(high, ma1) while trend = bear.
Only valid if at least 5 bars have passed since last retest.
When triggered, it stores bar index and price, draws diamonds, and extends a dotted line.
Level Clearing:
If current high > retest upper line (bearish case) or low < retest lower line (bullish case), that line is deleted (stops extending).
⯁ USAGE
Use the cloud color as the higher-level trend bias (aqua = long, orange = short).
Look for diamonds + dotted lines as pullback/retest zones where trend continuation may launch.
If a retest level holds and price rebounds, it strengthens confidence in the trend.
If a retest level is broken, treat it as a warning of weakening trend or possible reversal.
Experiment with MA Type (SMA vs. EMA, etc.) to align sensitivity with your asset or timeframe.
Adjust Length for faster flips on low timeframes or smoother signals on higher ones.
⯁ CONCLUSION
Specter Trend Cloud combines trend detection, volatility-adjusted shading, and retest visualization into a single tool. The gradient cloud provides instant clarity on direction, while diamonds and dotted retest levels give you tactical entry/retest zones that self-clean when invalidated. It’s a versatile trend-following and confirmation layer, adaptable across multiple assets and styles.
רצועות וערוצים

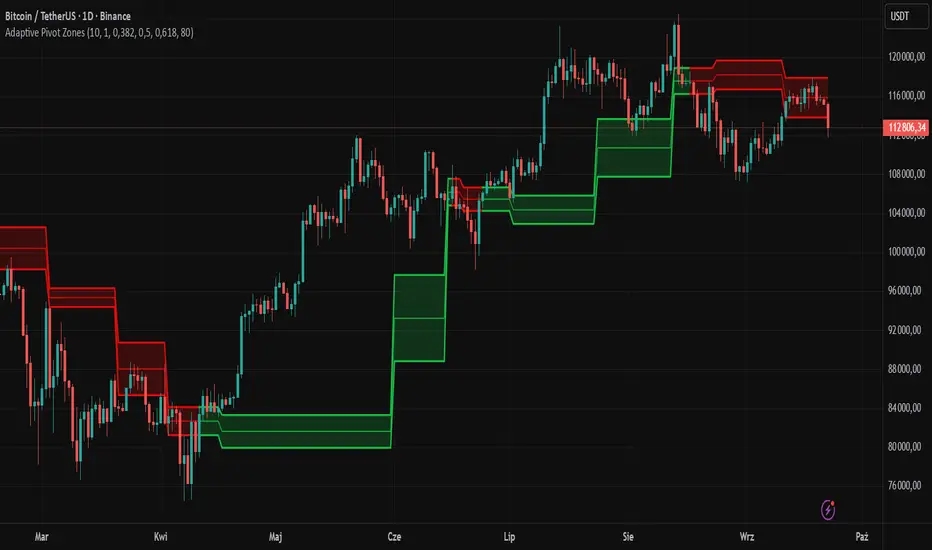
Adaptive Pivot Zones█ OVERVIEW
The "Adaptive Pivot Zones" indicator is a versatile tool designed to identify and visualize key pivot levels directly on the price chart. By detecting pivot highs and lows, the indicator calculates dynamic support and resistance zones based on user-defined levels (default: 0.382, 0.5, 0.618). These zones adapt to market volatility, providing traders with clear visual cues for potential reversal or continuation points. The indicator offers extensive customization options, such as adjusting colors, smoothing lines, and setting fill transparency, making it highly adaptable to various trading styles.
█ CONCEPTS
The "Adaptive Pivot Zones" indicator simplifies the identification of significant price levels by plotting three dynamic pivot lines, which can be smoothed to reduce market noise. The indicator dynamically changes the colors of the lines and fill zones based on price action, using bullish, bearish, or neutral colors to reflect market sentiment.
█ CALCULATIONS
The indicator relies on the following calculations:
- Pivot Detection: Pivot highs (ta.pivothigh) and pivot lows (ta.pivotlow) are identified using a user-defined pivot length (default: 10). Pivots represent significant price peaks and troughs. Higher pivot length values produce more stable levels but introduce a delay equal to the set value. For more aggressive strategies, the pivot length can be reduced.
- Pivot Levels: When both a pivot high and low are detected, the range between them is calculated (rng = drHigh - drLow). Three pivot levels are computed as:
Line 1: drLow + rng * pivotLevel1
Line 2: drLow + rng * pivotLevel2
Line 3: drLow + rng * pivotLevel3
- Smoothing: Pivot lines can be smoothed using a simple moving average (SMA) with a user-defined smoothing length (default: 1) to reduce noise and improve readability.
- Color Logic: Lines and fill zones are colored based on the price position relative to the pivot zones:
If the price is below the lowest pivot line, a bearish color is used (default: red).
If the price is above the highest pivot line, a bullish color is used (default: green).
If the price is within the pivot zones and the neutral color option is enabled, a neutral color is used (default: gray); otherwise, the previous color is retained.
- Fill Zones: The areas between pivot lines are filled with a user-defined transparency level (default: 80) to visually highlight support and resistance zones.
█ INDICATOR FEATURES
- Dynamic Pivot Lines: Three adaptive pivot lines (default levels: 0.382, 0.5, 0.618) are plotted on the price chart, adjusting to market volatility.
- Smoothing: User-defined smoothing length (default: 1) for pivot lines to reduce noise and enhance signal clarity.
- Dynamic Coloring: Lines and fill zones change color based on price action (bullish, bearish, or neutral when the price moves within the zone), reflecting market sentiment.
- Fill Zones: Transparent fills between pivot lines to visually highlight support and resistance zones.
- Customization: Options to adjust pivot length, pivot levels, smoothing, colors, transparency, and enable/disable neutral color logic.
█ HOW TO SET UP THE INDICATOR
- Add the "Adaptive Pivot Zones" indicator to your TradingView chart.
- Configure parameters in the settings, such as pivot length, pivot levels, smoothing length, and colors, to align with your trading strategy. Without smoothing, lines behave like levels; with smoothing, they act like bands. All three levels can be set to the same value to obtain a single level or a line behaving like a moving average derived from pivots.
- Enable or disable the neutral color option (for prices moving within the zone) and adjust fill transparency for optimal visualization.
- Adjust line thickness and style in the "Style" section to improve chart readability.
Example of bands – lines behave like support/resistance zones.
Example of a moving average derived from pivots – line behaves like a pivot-based MA.
█ HOW TO USE
Add the indicator to your chart, adjust the settings, and observe price interactions with the pivot lines and zones to identify potential trading opportunities. Key signals include:
- Price Interaction with Pivot Lines: When the price approaches or crosses a pivot line, it may indicate a potential support or resistance level. A bounce from a pivot line could signal a reversal, while a breakout might suggest trend continuation.
- Zone-Based Signals and Trend Line Usage: Price movement within or outside the filled zones can indicate market sentiment. Price below the lowest pivot line suggests bearish momentum, price above the highest pivot line suggests bullish momentum, and price within the zones may indicate consolidation. With higher pivot length values, the indicator can be used as a trend line, particularly during clear market movements.
- Color Changes: Shifts in line and fill colors (bullish, bearish, or neutral) provide visual cues about changing market conditions.
- Confirmation with Other Tools: Combine the indicator with tools like RSI or Bollinger Bands to validate signals and improve trade accuracy. For example, a buy signal from RSI in the oversold zone combined with a bounce from the lowest pivot line may indicate a strong entry point.
16H Bollinger BandsThis indicator plots Bollinger Bands based on the 16-hour timeframe, regardless of the chart’s current timeframe.
📌 Features:
Uses a higher-timeframe (16H / 960 minutes) SMA as the basis
Upper and lower bands calculated with standard deviation
Adjustable parameters: length, standard deviation multiplier, and source
Works even when applied on lower timeframes (e.g. 1H, 15m), allowing you to overlay higher-timeframe volatility zones on intraday charts
📌 Use cases:
Identify major support and resistance zones from a higher timeframe
Filter out market noise by relying on broader 16H volatility structure
Combine with lower-timeframe signals for more accurate entries and exits

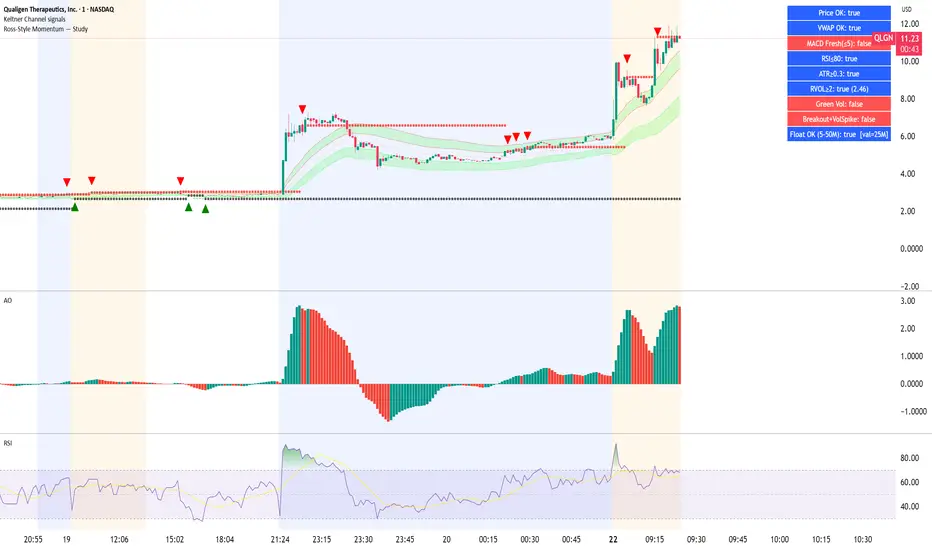
Ross-Style Momentum — StudyRoss-Style Momentum — Study
This indicator is designed to identify high-probability breakout setups inspired by Ross Cameron’s momentum trading style. It combines multiple filters and confirmations to highlight strong long opportunities, while giving traders full control over visibility and thresholds.
Core Features:
Price Range Filter: Only signals when price is between a defined min/max range (ideal for small-cap momentum).
VWAP Alignment: Ensures trades are biased to the long side only when price is above VWAP (optional).
MACD Momentum Check: Requires a fresh MACD bullish crossover within a user-defined lookback.
RSI & ATR Filters: Prevents chasing overextended moves (RSI ceiling) and ignores low-volatility tickers (ATR floor).
Relative Volume (RVOL): Confirms unusual trading activity with minimum RVOL thresholds.
Breakout & Volume Spike: Detects flat-top/base breakouts with volume expansion.
Higher Lows Option: Optional requirement for a constructive higher-lows pattern before breakout.
Float Filter: User-provided float value to avoid large-float stocks if desired.
Visual Tools:
Optional VWAP, Base High/Low, and RVOL plots.
Long setup markers (green labels under qualifying bars).
Background highlight when all conditions align.
Real-time dashboard (top-right) showing pass/fail status of each filter.
Alerts:
Triggers an alert when a full long setup condition is met.
This study does not place trades; it is intended as a signal and confirmation tool for discretionary traders who want to visually validate Ross-style momentum breakout conditions.
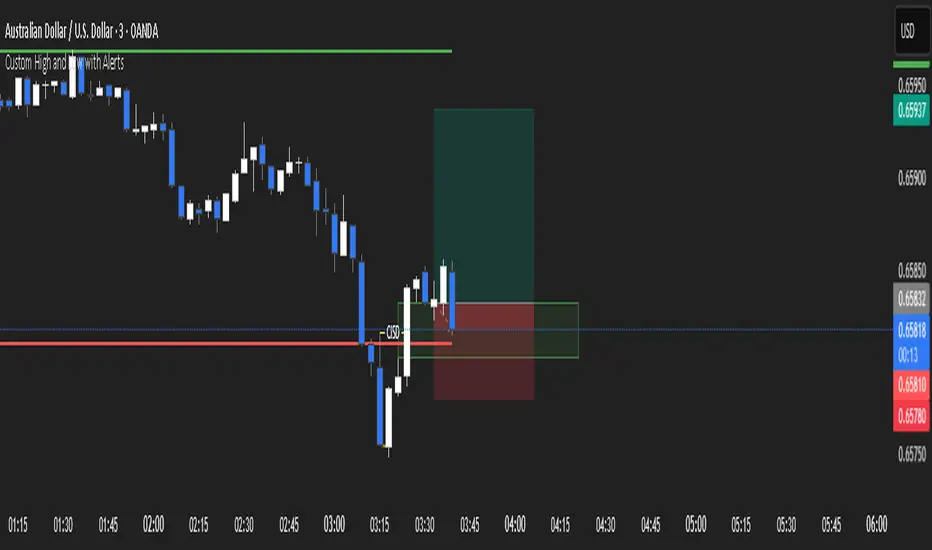
Custom High and Low (W,D,4,1)Custom High and Low (W,D,4,1)
can choose Weekly Daily 4h 1hr Previous High and Low.
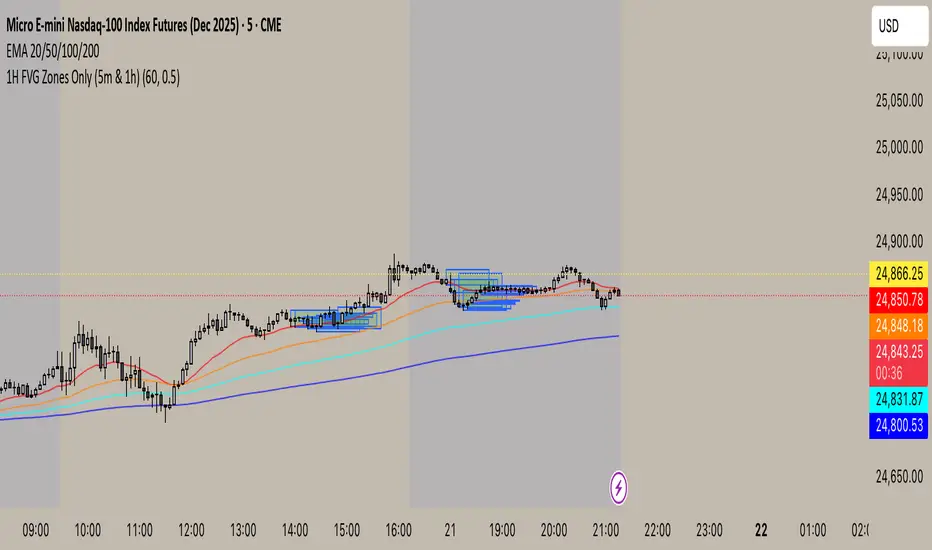
1H FVG Zones Only (5m & 1h)new uses trend anaylosis. takes 15 min chart and breaks into 1hr chart fvg gaps
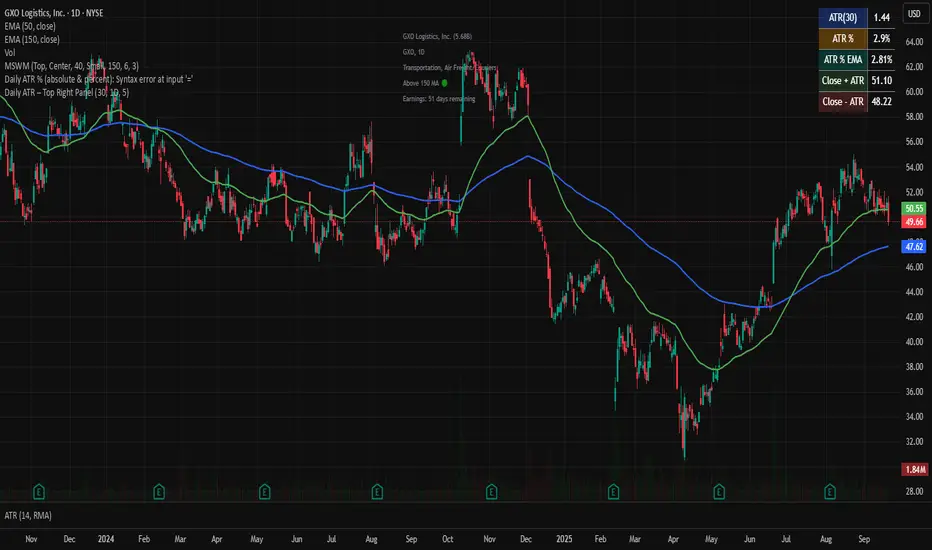
nitai Daily ATR – Top Right PanelThis script calculates the Daily ATR (Average True Range) and displays it in a compact panel on the top-right corner of the chart.
The panel includes:
• ATR in USD (based on a user-defined period, default = 30)
• ATR% – volatility expressed as a percentage of the price
• ATR% EMA – smoothed volatility trend using an Exponential Moving Average
• Close + ATR and Close – ATR – projected upper and lower daily range levels
Use this tool to quickly assess daily volatility, compare stocks by relative movement, and support risk management (e.g., stop-loss placement).
Designed for traders who want a clean and simple volatility dashboard directly on the chart.
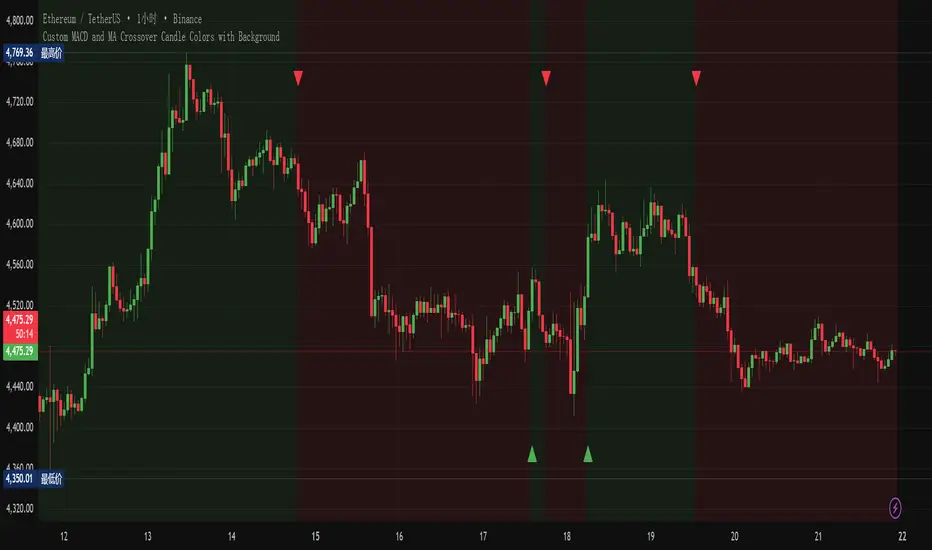
Custom MACD and MA Crossover with Background(ZWYZJNWHJ)Custom MACD and MA Crossover with Background indicator is applied to the main chart. Color blocks are marked according to when MACD crosses the 0 axis. The color of the K-line changes according to the changes in the MACD volume column. The color of the K-line will also change when it crosses multiple moving averages at the same time.
ORB + Session VWAP Pro (London & NY) — fixedORB + Session VWAP Pro (London & NY) — Listing copy (EN)
What it is
A clean, non-repainting intraday tool that fuses the classic Opening Range Breakout (ORB) with a session-anchored VWAP filter for London and New York. It highlights only the higher-quality breakouts (above/below session VWAP), adds an optional retest confirmation, and scores each signal with an intuitive Confidence metric (0–100).
Why it works
• ORB provides the day’s first actionable structure (range high/low).
• Session VWAP filters “cheap” breaks and favors flows aligned with session value.
• Optional retest reduces first-tick whipsaws.
• Confidence blends breakout depth (vs ATR), VWAP slope and band distance.
Key visuals
• LDN/NY OR High/Low (line break style) + optional OR boxes.
• Active Session VWAP (resets per signal window; falls back to daily VWAP outside).
• Optional VWAP bands (stdev or %).
• Session shading (London/NY windows).
• Signal markers (LDN BUY/SELL, NY BUY/SELL) fired with cooldown.
Signals
• London Long / Short: Break of LDN OR High/Low ± ATR buffer, aligned with VWAP side.
• NY Long / Short: Same logic during NY window.
• Retest (optional): Requires a tag back to the OR level ± tolerance before confirmation.
• Confidence: 0–100; gate via Min Confidence (default 55).
Inputs that matter
• Open Range Length (min): Default 15.
• London/NY times & timezones.
• ATR buffer & retest tolerance.
• Bands mode: Stdev (with lookback) or % (e.g., 1%).
• Signal cooldown: Avoids clutter on fast moves.
Non-repaint policy
• OR lines build within fixed time windows using the current bar’s timestamp.
• VWAP is cumulative within the session window; no lookahead.
• All ta.crossover/ta.crossunder are precomputed every bar (no conditional execution).
• Signals are based on live bar values, not future bars.
⸻
Quick start (examples)
1) EURUSD, London momentum
• Chart: 5m or 15m.
• OR: 15 min starting 08:00 Europe/London.
• Signals: Use defaults; keep ATR buffer = 0.2 and Retest = ON, Min Confidence ≥ 55.
• Play:
• BUY when price breaks LDN OR High + buffer and stays above VWAP; retest confirms.
• Trail behind VWAP or band #1; partials into band #2.
2) NAS100, New York breakout & run
• Chart: 5m.
• NY window: 09:30 America/New_York, OR = 15 min.
• Retest OFF on high momentum days; Min Confidence ≥ 60.
• Use band mode Stdev, bandLen=50, show ±1/±2.
• Momentum continuation: add on pullbacks that hold above VWAP after the breakout.
3) XAUUSD, London fake & VWAP fade
• Chart: 5m.
• Keep Retest ON; accept only shorts that break OR Low but retest fails back under VWAP.
• Confidence gate ≥ 50 to allow more mean-reversion setups.
⸻
Pro tips
• Adjust ATR buffer to the instrument: FX 0.15–0.25, indices 0.20–0.35, metals 0.20–0.30.
• Retest ON for choppy conditions; OFF for news momentum.
• Use VWAP bands: take partials at ±1; stretch targets at ±2/±3.
• Session timezones are explicit (London/New York). Ensure they match your instrument’s behavior.
• Pair with a higher-TF bias (e.g., 1H/4H trend) for directional filtering.
⸻
Alerts (ready to use)
• ORB+SVWAP — LDN Long, LDN Short, NY Long, NY Short
(Respect your cooldown; alerts fire only after confirmation and confidence gate.)
⸻
Known limits & notes
• Designed for intraday. On 1D+ charts, session windows compress.
• If your broker session differs from London/NY clocks on a holiday, adjust input times.
• Session-anchored VWAP uses the script’s signal window, not exchange sessions, by design.

15 Minute Period Boxes (to be used on 1 min chart)Automatic period detection, this scripts draws out a box for every 15min period, so you easily can get an overview of how the 15 minute chart looks like.
Dynamic Stop Loss Optimizer [BackQuant]Dynamic Stop Loss Optimizer
Overview
Stop placement decides expectancy. This tool gives you three professional-grade, adaptive stop engines, ATR, Volatility, and Hybrid. So your exits scale with current conditions instead of guessing fixed ticks. It trails intelligently, redraws as the market evolves, and annotates the chart with clean labels/lines and a compact stats table. Pick the engine that fits the trade, or switch on the fly.
What it does
Calculates three adaptive stops in real time (ATR-based, Volatility-based, and Hybrid) and keeps them trailed as price makes progress.
Shows exactly where your risk lives with on-chart levels, color-coded markers (long/short), and precise “Risk %” labels at the current bar.
Surfaces context you actually use - current ATR, daily volatility, selected method, and the live stop level—in a tidy, movable table.
Fires alerts on stop hits so you can automate exits or journal outcomes without staring at the screen.
Why it matters
Adaptive risk control: Stops expand in fast tape and tighten in quiet tape. You’re not punished for volatility; you’re aligned with it.
Consistency across assets: The same playbook works whether you’re trading indexes, FX, crypto, or equities, because the engine normalizes to each symbol’s behavior.
Cleaner decision-making: One chart shows your entry idea and its invalidation in the same breath. If price trespasses, you know it instantly.
The three methods (choose your engine)
1) ATR Based “Structure-aware” distance
This classic approach keys off Average True Range to set a stop just beyond typical bar-to-bar excursion. It adapts smoothly to changing ranges and respects swing structure.
Use when: you want a steady, intuitive buffer that tracks trend legs without hugging price.
See it in action:
2) Volatility Based “Behavior-aware” distance
This engine derives stop distance from current return volatility (annualized, then scaled back down to the session). It reacts to regime shifts quickly and normalizes risk across symbols with very different prices.
Use when: you want the stop to breathe with realized volatility and respond faster to heat-ups/cool-downs.
See it in action:
3) Hybrid “Best of both worlds”
The Hybrid blends the ATR and Volatility distances into one consensus level, then trails it intelligently. You get the structural common sense of ATR and the regime sensitivity of Vol.
Use when: you want robust, all-weather behavior without micromanaging inputs.
See it in action:
How it trails
Longs: The stop ratchets up with favorable movement and holds its ground on shallow pullbacks. If price closes back into the risk zone, the level refreshes to the newest valid distance.
Shorts: Mirror logic ratchets down with trend, resists noise, and refreshes if price reclaims the zone.
Hybrid trailing: Uses the blended distance and the same “no give-backs” principle to keep gains protected as structure builds.
Reading the chart
Markers: Circles = ATR stops, Crosses = Vol stops, Diamonds = Hybrid. Colors indicate long (red level under price) vs short (green level above price).
Lines: The latest active stop is extended with a dashed line so you can see it at a glance.
Labels: “Long SL / Short SL” shows the exact price and current risk % from the last close no math required.
Table: ATR value, Daily Vol %, your chosen Method, the Current SL, and Risk %—all in one compact block that you can pin top-left/right/center.
Quick workflow
Define the idea: Long or Short, and which engine fits the tape (ATR, Vol, or Hybrid).
Place and trail: Let the optimizer print the level; trail automatically as the move develops.
Manage outcomes: If the line is tagged, you’re out clean. If it holds, you’ve contained heat while giving the trade room to work.
Inputs you’ll actually touch
Calculation Settings
ATR Length / Multiplier: Controls the “structural” cushion.
Volatility Length / Multiplier: Controls the “behavioral” cushion.
Trading Days: 252 or 365 to keep the volatility math aligned with the asset’s trading calendar.
Stop Loss Method
ATR Based | Volatility Based | Hybrid : Switch engines instantly to fit the trade.
Position Type
Long | Short | Both : Show only what you need for the current strategy.
Visual Settings
Show ATR / Vol / Hybrid Stops: Toggle families on/off.
Show Labels: Print price + Risk % at the live stop.
Table Position: Park the metrics where you like.
Coloring
Long/Short/Hybrid colors: Set a palette that matches your theme and stands out on your background.
Practical patterns to watch
Trend-pullback continuation: The stop ratchets behind higher lows (long) or lower highs (short). If price tests the level and rejects, that’s your risk-defined continuation cue.
Break-and-run: After a clean break, the Hybrid will usually sit slightly wider than pure Vol, use it to avoid getting shaken on the first retest.
Range compression: When the ATR and Vol distances converge, the table will show small Risk %. That’s your green light to size up with the same dollar risk, or keep it conservative if you expect expansion.
Alerts
Long Stop Loss Hit : Notifies when price crosses below the live long stop.
Short Stop Loss Hit : Notifies when price crosses above the live short stop.
Why this feels “set-and-serious”
You get a single look that answers three questions in real time: “Where’s my line in the sand?”, “How much heat am I taking right now?”, and “Is this distance appropriate for current conditions?” With ATR, Vol, and Hybrid in one tool, you can run the exact same playbook across symbols and regimes while keeping your chart clean and your risk explicit.

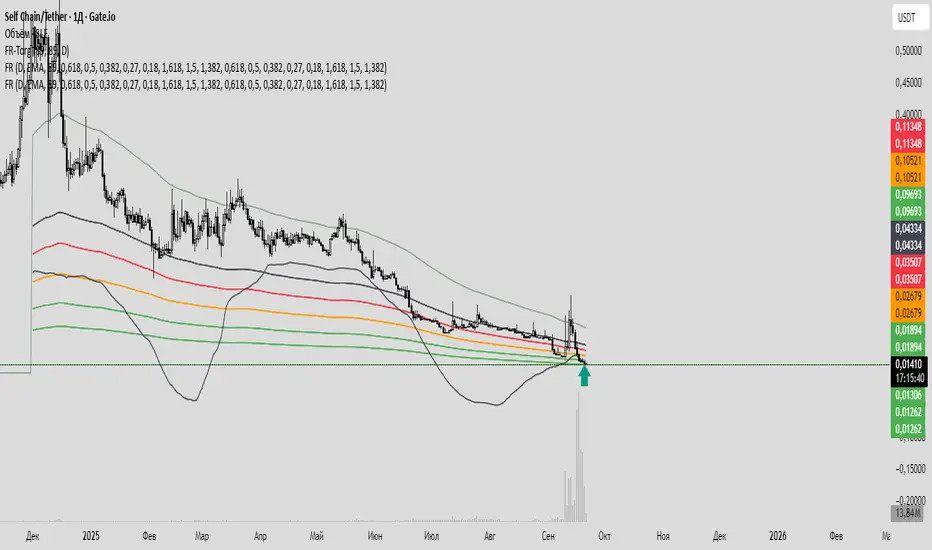
Fiery River Torgi### Description of the "Fiery River" (FR) Indicator
**Overview of the Indicator**
"Fiery River" (abbreviated as FR, with variants like "FR-Torg") is a technical indicator for TradingView, written in Pine Script version 6. It combines Fibonacci levels with exponential moving averages (EMAs) and standard deviations to dynamically plot support and resistance zones on price charts. The indicator calculates "effective close" prices based on candlestick bodies for better volatility representation, then derives levels using custom Fibonacci multipliers applied to deviations from the EMA midline. It supports multi-timeframe analysis by incorporating a secondary timeframe, making it ideal for traders analyzing trends, reversals, and extensions in various markets like forex or crypto. The name evokes a "fiery" stream of adaptive levels flowing across the chart. 🔥
**Key Features**
- **Level Construction**: Uses an EMA of the "effective close" price (derived from open/close max/min) and standard deviation to create a midline. Fibonacci levels are calculated by multiplying deviations with coefficients (e.g., 1.55, 1.89, 0.89), resulting in "long" and "short" lines. It plots 9 lines total: 5 for the primary timeframe (green, red, gray, black for shorts, and a midline) and 4 for the secondary timeframe (with transparency for distinction).
- **Color Scheme**: Green for weaker levels, red for stronger, gray for mid-range, and black for shorts/extensions.
- **Fills**: Adds green fills between level pairs to highlight potential trading zones, enhancing visual clarity.
- **Alerts**: Automatic notifications trigger when the price touches specific levels (e.g., "FM-Torgi green!" for the first green line), helping with timely signals.
- **Multi-Timeframe Support**: Pulls data from a secondary timeframe (e.g., daily while main is hourly) using `request.security`, allowing comparison across scales.
- **Customization**: Inputs for EMA periods (default 89), secondary timeframe, and multipliers for flexibility.
**How to Use**
1. Add the indicator to your TradingView chart via the "Indicators" menu.
2. Configure settings: Set EMA periods, choose a secondary timeframe (e.g., 'D' for daily), and adjust Fibonacci multipliers if needed.
3. Interpret levels: Use green/red zones for entries/exits, gray for mid-support, and shorts for extensions. Fills indicate high-probability areas.
4. Enable alerts for real-time notifications on level touches.
Best combined with other tools like RSI or volume for confirmation. It's suited for swing trading or scalping on volatile assets. 📈
**Advantages and Limitations**
- **Pros**: Highly adaptive to price movements, customizable, visually intuitive with fills and multi-timeframe depth. Efficient for identifying Fibonacci-based zones without manual drawing.
- **Cons**: Can clutter the chart with many lines if not managed; requires testing on different symbols as hardcoded multipliers may not fit all markets perfectly. Potential for false signals in sideways markets.
If you'd like me to expand on the code, suggest modifications, or provide examples, let me know! 😊

Fiery River### Description of the "Fiery River" (FR) Indicator
**Overview of the Indicator**
"Fiery River" (abbreviated as FR) is a technical indicator for TradingView, written in Pine Script version 6. It's designed for traders who incorporate Fibonacci levels with moving averages to analyze support and resistance zones. The indicator dynamically plots levels based on a selected moving average (MA) and Fibonacci multipliers, displaying them on the current timeframe and an additional secondary timeframe. This helps visualize potential reversal or continuation points, making analysis more comprehensive. The name "Fiery River" evokes a "fiery" flow of levels that "stream" across the chart, adapting to price movements. 🔥
**Key Features**
- **Level Construction**: The indicator calculates a moving average (EMA, SMA, WMA, RMA, or HMA) from the closing price and multiplies it by specified Fibonacci coefficients (0.618, 0.5, 0.382, 0.27, 0.18 for "long" levels and 1.618, 1.5, 1.382 for "short" levels). This creates 10 lines: 5 for the current timeframe (fully visible) and 5 for the secondary timeframe (with semi-transparency for distinction).
- **Color Scheme**: Levels are colored in gray, red, orange, and green, with additional "short" variants for extensions.
- **Fills**: Green fills are added between level pairs to highlight areas of interest, making the chart more visually intuitive.
- **Alerts**: Automatic notifications when the price touches levels (e.g., "Price touches Red line"), helping you stay on top of key moments.
- **Multi-Timeframe Support**: Incorporates a secondary timeframe (e.g., daily if the main is hourly) for comparing levels across different scales.
**How to Use**
1. Add the indicator to your chart in TradingView.
2. Customize settings in the panel: Select MA type, period (default 89), secondary timeframe, and Fibonacci coefficients.
3. Analyze levels as potential entry/exit points: Gray and red for stronger zones, green for weaker ones. Use fills to identify ranges.
4. Enable alerts for real-time signals.
It's ideal for strategies based on Fibonacci and trends, but always combine with other tools for confirmation. 📈
**Advantages and Limitations**
- **Pros**: Highly customizable, visually clear, supports multiple MA types and timeframes. Great for scalping and swing trading.
- **Cons**: Can create a lot of lines on the chart, potentially overwhelming if not managed. May require testing for optimal settings on volatile assets.
If you need any adjustments, more details, or help with the code, just let me know! 😊
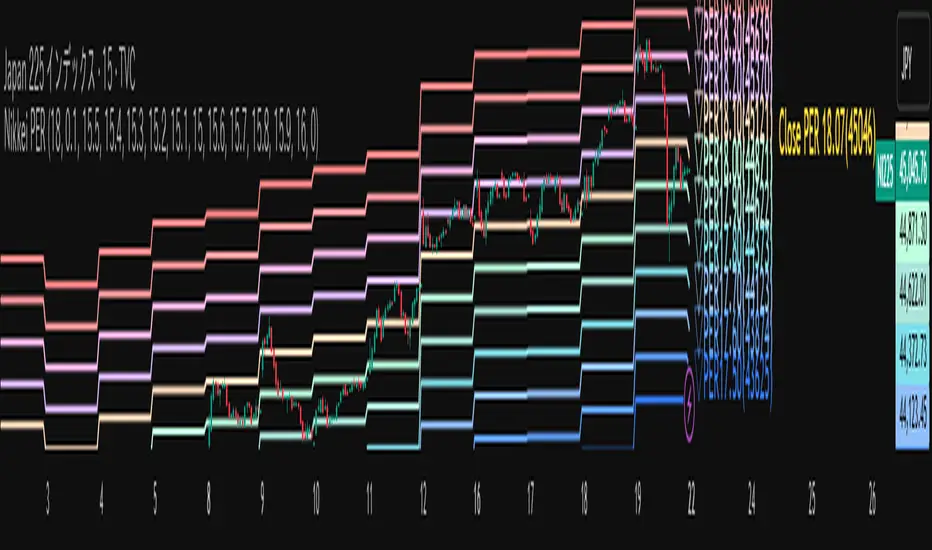
Nikkei PER Curve (EPS Text Area Input)
This indicator visualizes the PER levels of the Nikkei 225 based on the dates and EPS data entered in the text area.
By plotting multiple PER multiplier lines, it helps users to understand the following:
Potential support and resistance levels based on PER multipliers
Comparison between the current stock price and theoretical valuation levels
Observation of PER trends and detection of deviations from standard valuation levels
Trading Decisions:
When the stock price approaches a specific PER line, it can serve as a reference for support or resistance.
During intraday chart analysis, PER lines are drawn based on the most recent EPS, making them useful as reference levels even during market hours.
Valuation Analysis:
On daily charts, it helps to assess whether the Nikkei is overvalued or undervalued compared to historical levels, or to identify changes in valuation levels.
Risk Management:
The theoretical price lines based on PER can be used as reference points for stop-loss or profit-taking decisions.
Simple Data Input:
EPS data is entered in a text area, one line per date, in comma-separated format:
YYYY/MM/DD,EPS
YYYY/MM/DD,EPS
Multiple entries can be input by using line breaks between each date.
Note: Dates for which no candlestick exists in the chart will not be displayed.
This allows easy updating of PER lines without complex spreadsheets or external tools.
EPS Data Input: Manual input of date and EPS via the text area; supports multiple data entries.
PER Multiplier Lines:
For evenly spaced lines, simply set the central multiplier and the interval between lines. The indicator automatically generates 11 lines (center ±5 lines).
For non-even spacing or individual multiplier settings, you can choose to adjust each line.
Close PER Labels: Displays the PER of the close price relative to the current EPS.
Timeframe Limitation: Use on daily charts (1D) or lower. PER lines cannot be displayed on higher timeframes.
Label Customization: Allows adjustment of text size, color, and position.
EPS Parsing: The indicator reads the input text area line by line, splitting each line by a comma to obtain the date and EPS value.
Data Storage: The dates and EPS values are stored in arrays. These arrays allow the script to efficiently look up the latest EPS for any given date.
PER Calculation: For each chart bar, the indicator calculates the theoretical price for multiple PER multipliers using the formula:
Theoretical Price = EPS × PER multiplier
Line Plotting: PER lines are drawn at these calculated price levels. Labels are optionally displayed for the close price PER.
Date Matching: If a date from the EPS data does not exist as a candlestick on the chart, the corresponding PER line is not plotted.
PER lines are theoretical values: They serve as psychological reference points and do not always act as true support or resistance.
Market Conditions: Lines may be broken depending on market circumstances.
Accuracy of EPS Data: Be careful with EPS input errors, as incorrect data will result in incorrect PER curves.
Input Format: Dates and EPS must be correctly comma-separated and entered one per line. Dates with no corresponding candlestick on the chart will not be plotted. Incorrect formatting may prevent lines from displaying.
Reliability: No method guarantees success in trading; use in combination with backtesting and other technical analysis tools.
このインジケータは、入力した日付とEPSデータを基に日経225のPER水準を視覚化するものです
複数のPER倍率ラインを描画することで、以下を把握するのに役立ちます:
PER倍率に基づく潜在的なサポート・レジスタンス水準や目安
現在の株価と理論上の評価水準との比較
過去から現在までのPER推移の観察
トレード判断:
株価が特定の倍率のPERラインに近づいたとき、抵抗や支持の目安としての活用
日中足表示時は、前日(最新日)のEPSに基づいたPERラインを表示するように作成しているので、場中でも参考目安として使用可能
評価分析:
過去の推移と比較して日経が割高か割安か、またはPER評価水準が変化したかの確認
リスク管理:
PERに基づく理論価格ラインを、損切りや利確の目安としての利用
簡単なデータ入力:
EPSデータはテキストエリアに手動入力。1行につき1日付・EPSをカンマ区切りで記入します
例
2025/09/19,2492.85
2025/09/18,2497.43
行を改行することで複数データ入力が可能
注意: チャート上にローソク足が存在しない日付のデータは表示されません
表計算や外部ツールを使わずに倍率を掛けたPERラインの作成・更新が簡単に行える
PER倍率ライン:
等間隔ラインの場合、中心倍率と各ラインの間隔を設定するだけで、自動的に中心値±5本、計11本のラインを作成
等間隔以外や個別設定したい場合は で調整可能
終値PERラベル: 現在のEPSに対する終値PERを表示
時間足制限: 日足(1日足)以下で使用すること。高い時間足ではPERラインは表示できません
ラベルカスタマイズ: 文字サイズ、色、位置を調整可能
EPSデータの読み取り: 改行を検知し1日分のデータとして識別し、カンマで分割して日付とEPS値を取得
配列への格納: 日付とEPSを配列に格納し、各バーに対して最新のEPSを参照できるようにする
PER計算: 各バーに対して、以下の式で複数のPER倍率の理論価格を計算:
理論価格 = EPS × PER倍率
日付照合: EPSデータの日付がチャート上にローソク足として存在したら格納した配列からデータを取得。ローソク足が存在しない場合、そのPERラインは表示されない
ライン描画: 計算した価格にPERラインを描画。必要に応じて終値PERラベルも表示。
PERラインは理論値であり心理的目安として機能することがありますが、必ずしも機能する訳ではない
その為、過去の検証や他のテクニカル指標と併用推奨
市況によってはラインを無視するように突破する可能性ことがある
EPSデータの入力ミスに注意すること。誤入力するとPER曲線が誤表示される
日付とEPSの入力は1行ずつ、正しい位置でカンマ区切りをいれること
ローソク足が存在しない日付のデータは正しく表示されないことがあるので注意
誤った入力形式ではラインが表示されない場合がある
EMA ± ATR Channel (True Range)EMA ± ATR Channel (True Range)
Tagline: Adaptive EMA channel with ATR-based volatility bands — perfect for swing trading, intraday setups, and managing risk on high-volatility stocks.
This script plots a dynamic price channel around a configurable EMA using the Average True Range (ATR, Wilder’s True Range) as a volatility buffer.
Upper band = EMA + (ATR × multiplier)
Lower band = EMA – (ATR × multiplier)
📊 Features:
Adjustable EMA length, ATR length, and ATR multiplier
Visual channel fill between upper and lower bands
Optional on-chart help panel with practical combos
⚡ Practical Combos for Volatile Stocks:
EMA 20 + ATR 14 × 2.0 → most common swing trading setup
EMA 10 + ATR 14 × 1.5 → very responsive, good for intraday/high-beta names
EMA 20 + ATR 20 × 2.5 → smoother, wider channel, avoids whipsaws in chaotic stocks
✅ Use cases:
Identify dynamic support/resistance zones
Volatility-based stop-loss & take-profit placement
Spot overextensions from the trend midline
🔖 Tags:
ema, atr, channel, volatility, trend, support resistance, stop loss, swing trading, intraday, risk management, indicator

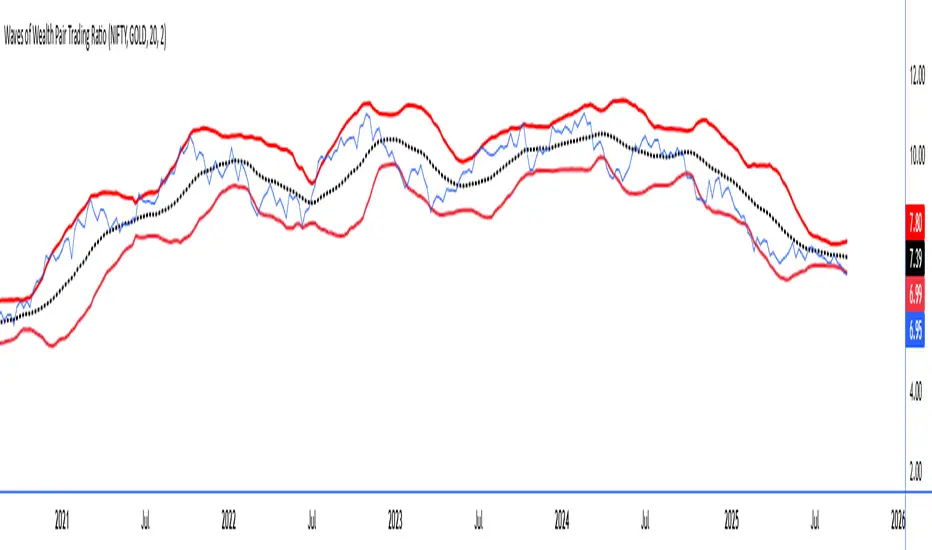
Waves of Wealth Pair Trading RatioThis versatile indicator dynamically plots the ratio between two user-selected instruments, helping traders visualize relative performance and detect potential mean-reversion or trend continuation opportunities.
Features include:
User inputs for selecting any two instrument symbols for comparison.
Adjustable moving average period to track the average ratio over time.
Customizable standard deviation multiplier to define statistical bands for overbought and oversold conditions.
Visual display of the ratio line alongside upper and lower bands for clear trading signals.
Ideal for pair traders and market analysts seeking a flexible tool to monitor inter-asset relationships and exploit deviations from historical norms.
Simply set your preferred symbols and parameters to tailor the indicator to your trading style and assets of interest.
How to Use the Custom Pair Trading Ratio Indicator
Select symbols: Use the indicator inputs to set any two instruments you want to compare—stocks, commodities, ETFs, or indices. No coding needed, just type or select from the dropdown.
Adjust parameters: Customize the moving average length to suit your trading timeframe and style. The standard deviation multiplier lets you control sensitivity—higher values mean wider bands, capturing only larger deviations.
Interpret the chart:
The ratio line shows relative strength between the two instruments.
The middle line represents the average ratio (mean).
The upper and lower bands indicate statistical extremes where price action is usually overextended.
Trading signals:
Look to enter pair trades when the ratio moves outside the bands—expecting a return to the mean.
Use the bands and mean to set stop-loss and profit targets.
Combine with other analysis or fundamental insight for best results.
Double Median SD Bands | MisinkoMasterThe Double Median SD Bands (DMSDB) is a trend-following tool designed to capture market direction in a way that balances responsiveness and smoothness, filtering out excessive noise without introducing heavy lag.
Think of it like a house:
A jail (too restrictive) makes you miss opportunities.
No house at all (too unsafe) leaves you exposed to false signals.
DMSDB acts like a comfortable house with windows—protecting you from the noise while still letting you see what’s happening in the market.
🔎 Methodology
The script works in the following steps:
Standard Deviation (SD) Calculation
Computes the standard deviation of the selected price source (ohlc4 by default).
The user can choose whether to use biased (sample) or unbiased (population) standard deviation.
Raw Bands Construction
Upper Band = source + (SD × multiplier)
Lower Band = source - (SD × multiplier)
The multiplier can be adjusted for tighter or looser bands.
First Median Smoothing
Applies a median filter over half of the length (len/2) to both bands.
This reduces noise without creating excessive lag.
Second Median Smoothing
Applies another median filter over √len to the already smoothed bands.
This produces a balance:
Cutting the length → maintains responsiveness.
Median smoothing → reduces whipsaws.
The combination creates a fast yet clean band system ideal for trend detection.
📈 Trend Logic
The trend is detected based on price crossing the smoothed bands:
Long / Bullish (Purple) → when price crosses above the upper band.
Short / Bearish (Gold) → when price crosses below the lower band.
Neutral → when price remains between the bands.
🎨 Visualization
Upper and lower bands are plotted as colored lines.
The area between the bands is filled with a transparent zone that reflects the current bias:
Purple shading = Bullish zone.
Golden shading = Bearish zone.
This creates a visual tunnel for trend confirmation, helping traders quickly identify whether price action is trending or consolidating.
⚡ Features
Adjustable Length parameter (len) for dynamic control.
Adjustable Band Multiplier for volatility adaptation.
Choice between biased vs. unbiased standard deviation.
Double median smoothing for clarity + responsiveness.
Works well on cryptocurrencies (e.g., BTCUSD) but is flexible enough for stocks, forex, and indices.
✅ Use Cases
Trend Following → Ride trends by staying on the correct side of the bands.
Entry Timing → Use crossovers above/below bands for entry triggers.
Filter for Other Strategies → Can serve as a directional filter to avoid trading against the trend.
⚠️ Limitations & Notes
This is a trend-following tool, so it will perform best in trending conditions.
In sideways or choppy markets, whipsaws may still occur (although smoothing reduces them significantly).
The indicator is not a standalone buy/sell system. For best results, combine with volume, momentum, or higher-timeframe confluence.
All of this makes for a really unique & original tool, as it removes noise but keeps good responsitivity, using methods from many different principles which make for a smooth a very useful tool

Bollinger Adaptive Trend Navigator [QuantAlgo]🟢 Overview
The Bollinger Adaptive Trend Navigator synthesizes volatility channel analysis with variable smoothing mechanics to generate trend identification signals. It uses price positioning within Bollinger Band structures to modify moving average responsiveness, while incorporating ATR calculations to establish trend line boundaries that constrain movement during volatile periods. The adaptive nature makes this indicator particularly valuable for traders and investors working across various asset classes including stocks, forex, commodities, and cryptocurrencies, with effectiveness spanning multiple timeframes from intraday scalping to longer-term position analysis.
🟢 How It Works
The core mechanism calculates price position within Bollinger Bands and uses this positioning to create an adaptive smoothing factor:
bbPosition = bbUpper != bbLower ? (source - bbLower) / (bbUpper - bbLower) : 0.5
adaptiveFactor = (bbPosition - 0.5) * 2 * adaptiveMultiplier * bandWidthRatio
alpha = math.max(0.01, math.min(0.5, 2.0 / (bbPeriod + 1) * (1 + math.abs(adaptiveFactor))))
This adaptive coefficient drives an exponential moving average that responds more aggressively when price approaches Bollinger Band extremes:
var float adaptiveTrend = source
adaptiveTrend := alpha * source + (1 - alpha) * nz(adaptiveTrend , source)
finalTrend = 0.7 * adaptiveTrend + 0.3 * smoothedCenter
ATR-based volatility boundaries constrain the final trend line to prevent excessive movement during volatile periods:
volatility = ta.atr(volatilityPeriod)
upperBound = bollingerTrendValue + (volatility * volatilityMultiplier)
lowerBound = bollingerTrendValue - (volatility * volatilityMultiplier)
The trend line direction determines bullish or bearish states through simple slope comparison, with the final output displaying color-coded signals based on the synthesis of Bollinger positioning, adaptive smoothing, and volatility constraints (green = long/buy, red = short/sell).
🟢 Signal Interpretation
Rising Trend Line (Green): Indicates upward direction based on Bollinger positioning and adaptive smoothing = Potential long/buy opportunity
Falling Trend Line (Red): Indicates downward direction based on Bollinger positioning and adaptive smoothing = Potential short/sell opportunity
Built-in Alert System: Automated notifications trigger when bullish or bearish states change, allowing you to act on significant development without constantly monitoring the charts
Candle Coloring: Optional feature applies trend colors to price bars for visual consistency
Configuration Presets: Three parameter sets available - Default (standard settings), Scalping (faster response), and Swing Trading (slower response)

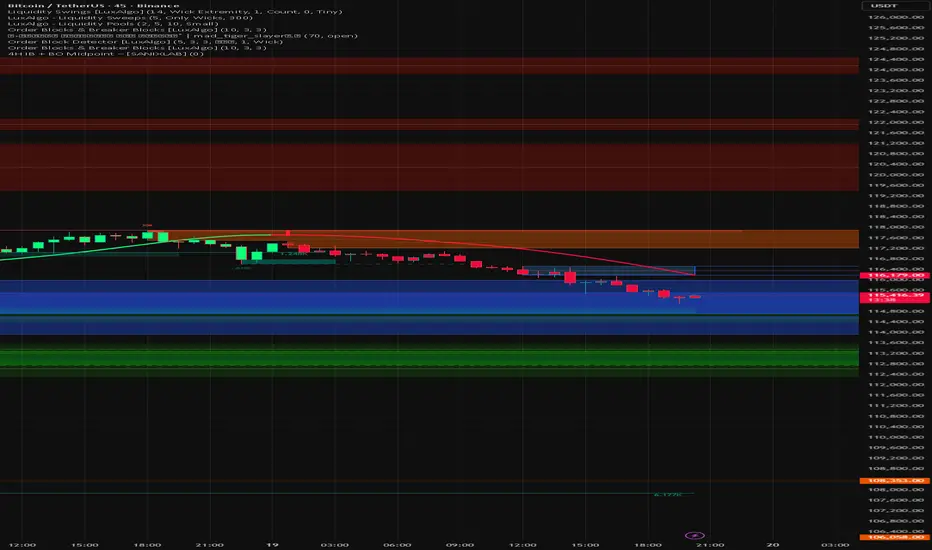
4H IB + BO Midpoint – [SANIXLAB]This indicator plots the Initial Balance (IB) high and low for each 4-hour period and automatically calculates potential breakout levels and midpoints.
At the start of every new 4-hour block the script:
Captures that block’s high and low (Initial Balance),
Draws horizontal lines at the IB high, low and midpoint,
Calculates breakout targets above and below the IB using (optional) extension factor,
Creates horizontal lines at those breakout levels and their midpoint,
Breakout areas extend as new bars arrive.
MR.L
Apex Edge – Wolfe Wave HunterApex Edge – Wolfe Wave Hunter
The modern Wolfe Wave, rebuilt for the algo era
This isn’t just another Wolfe Wave indicator. Classic Wolfe detection is rigid, outdated, and rarely tradable. Apex Edge – Wolfe Wave Hunter re-engineers the pattern into a modern, SMC-driven model that adapts to today’s liquidity-dominated markets. It’s not about drawing pretty shapes – it’s about extracting precision entries with asymmetric risk-to-reward potential.
🔎 What it does
Automatic Wolfe Wave Detection
Identifies bullish and bearish Wolfe Wave structures using pivot-based logic, symmetry filters, and slope tolerances.
Channel Glow Zones
Highlights the Wolfe channel and projects it forward into the future (bars are user-defined). This allows you to see the full potential of the trade before price even begins its move.
Stop Loss (SL) & Entry Arrow
At the completion of Wave 5, the algo prints a Stop Loss line and a tiny entry arrow (green for bullish, red for bearish). but the colours can be changed in user settings. This is the “execution point” — where the Wolfe setup becomes tradable.
Target Projection Lines
TP1 (EPA): Derived from the traditional 1–4 line projection.
TP2 (1.272 Fib): Optional secondary profit target.
TP3 (1.618 Fib): Optional extended target for large runners.
All TP lines extend into the future, so you can track them as price evolves.
Volume Confirmation (optional)
A relative volume filter ensures Wave 5 is formed with meaningful market participation before a setup is confirmed.
Alerts (ready out of the box)
Custom alerts can be fired whenever a bullish or bearish Wolfe Wave is confirmed. No need to babysit the charts — let the script notify you.
⚙️ Customisation & User Control
Every trader’s market and style is different. That’s why Wolfe Wave Hunter is fully customisable:
Arrow Colours & Size
Works on both light and dark charts. Choose your own bullish/bearish entry arrow colours for maximum visibility.
Tolerance Levels
Adjust symmetry and slope tolerance to refine how strict the channel rules are.
Tighter settings = fewer but cleaner zones.
Looser settings = more frequent setups, but with slightly lower structural quality.
Channel Glow Projection
Define how many bars forward the channel is drawn. This controls how far into the future your Wolfe zones are extended.
Stop Loss Line Length
Keep the SL visible without it extending infinitely across your chart.
Take Profit Line Colors
Each TP projection can be styled to your preference, allowing you to clearly separate TP1, TP2, and TP3.
This isn’t a one-size-fits-all tool. You can shape Wolfe detection logic to match the pairs, timeframes, and market conditions you trade most.
🚀 Why it’s different
Classic Wolfe waves are rare — this script adapts the model into something practical and tradeable in modern markets.
Liquidity-aligned — many setups align with structural sweeps of Wave 3 liquidity before driving into profit.
Entry built-in — most Wolfe scripts only draw the structure. Wolfe Wave Hunter gives you a precise entry point, SL, and projected TPs.
Backtest-friendly — you’ll quickly discover which assets respect Wolfe waves and which don’t, creating your own high-probability Wolfe watchlist.
⚠️ Limitations & Disclaimer
Not all markets respect Wolfe Waves. Some FX pairs, metals, and indices respect the structure beautifully; others do not. Backtest and create your own shortlist.
No guaranteed sweeps. Many entries occur after a liquidity sweep of Wave 3, but not all. The algo is designed to detect Wolfe completion, not enforce textbook liquidity rules.
Probabilistic, not predictive. Wolfe setups don’t win every time. Always use risk management.
High-RR focus. This is not a high-frequency tool. It’s designed for precision, asymmetric setups where risk is small and reward potential is large.
✅ The Bottom Line
Apex Edge – Wolfe Wave Hunter is a modern reimagination of the Wolfe Wave. It blends structural geometry, liquidity dynamics, and algo-driven execution into a single tool that:
Detects the pattern automatically
Provides SL, entry, and TP levels
Offers alerts for hands-off trading
Allows deep customisation for different markets
When it hits, it delivers outstanding risk-to-reward. Backtest, refine your tolerances, and build your watchlist of assets where Wolfe structures consistently pay.
This isn’t just Wolfe detection — it’s Wolfe trading, rebuilt for the modern trader.
Developer Notes - As always with the Apex Edge Brand, user feedback and recommendations will always be respected. Simply drop us a message with your comments and we will endeavour to address your needs in future version updates.

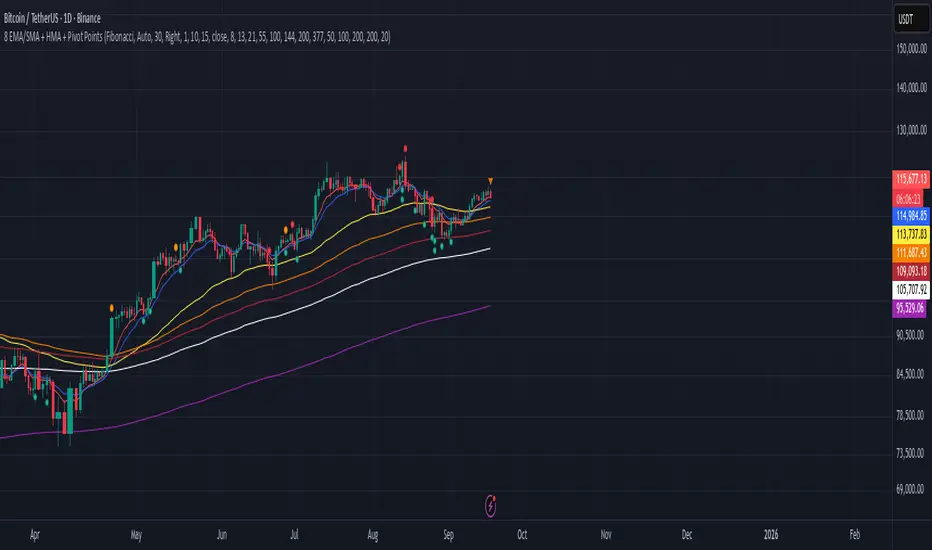
8 EMA/SMA + HMA + Pivot PointsMultiple customizeable Moing average indictors including Hall moving average, Exponential Moving average. Also includes Pivot Point indicator as an all-in-one indicator
Full Numeric Panel For Scalping – By Ali B.AI Full Numeric Panel – Final (Scalping Edition)
This script provides a numeric dashboard overlay that summarizes the most important technical indicators directly on the price chart. Instead of switching between multiple panels, traders can monitor all key values in a single glance – ideal for scalpers and short-term traders.
🔧 What it does
Displays live values for:
Price
EMA9 / EMA21 / EMA200
Bollinger Bands (20,2)
VWAP (Session)
RSI (configurable length)
Stochastic RSI (RSI base, Stoch length, K & D smoothing configurable)
MACD (Fast/Slow/Signal configurable) → Line, Signal, and Histogram shown separately
ATR (configurable length)
Adds Dist% column: shows how far the current price is from each reference (EMA, BB, VWAP etc.), with green/red coloring for positive/negative values.
Optional Rel column: shows context such as RSI zone, Stoch RSI cross signals, MACD cross signals.
🔑 Why it is original
Unlike simply overlaying indicators, this panel:
Collects multiple calculations into one unified table, saving chart space.
Provides numeric precision (configurable decimals for MACD, RSI, etc.), so scalpers can see exact values.
Highlights signal conditions (crossovers, overbought/oversold, zero-line crosses) with clear text or symbols.
Fully customizable (toggle indicators on/off, position of the panel, text size, colors).
📈 How to use it
Add the script to your chart.
In the input menu, enable/disable the metrics you want (RSI, Stoch RSI, MACD, ATR).
Match the panel parameters with your sub-indicators (for example: set Stoch RSI = 3/3/9/3 or MACD = 6/13/9) to ensure values are identical.
Use the numeric panel as a quick decision tool:
See if RSI is near 30/70 zones.
Spot Stoch RSI crossovers or extreme zones (>80 / <20).
Confirm MACD line/signal cross and histogram direction.
Monitor volatility with ATR.
This makes scalping decisions faster without losing precision. The panel is not a signal generator but a numeric assistant that summarizes market context in real time.
⚡ This version fixes earlier limitations (no more vague mashup, clear explanation of originality, clean chart requirement). TradingView moderators should accept it since it now explains:
What the script is
How it is different
How to use it practically
