VIX vs VIX1Y SpreadSpread Calculation: Shows VIX1Y minus VIX
Positive = longer-term vol higher (normal contango)
Negative = near-term vol elevated (inverted term structure)
Can help identify longer term risk pricing of equity assets.
BEST


GapCluster SR For Intraday by Chaitu50c**GapCluster SR For Intraday by Chaitu50c**
**Overview**
GapCluster SR plots dynamic intraday support and resistance lines based on candle-to-candle gaps. Whenever an Open/Close or High/Low gap is detected, the script draws a horizontal level and “clusters” nearby gaps into a single line to keep your chart clean. Lines automatically color-code relative to price—green when below, red when above.
---
**Key Features**
* **Gap Detection Modes**: Choose between Open/Close gaps (default) or High/Low gaps.
* **Clustering**: Merge levels within a user-defined vertical range to avoid clutter.
* **Dynamic Coloring**: Levels below price turn green; levels above price turn red.
* **Session Reset**: Automatically removes levels older than X days.
* **Fully Customizable**: Adjust buffer, cluster range, line width, lookback period, and both above/below colors.
---
**Inputs**
| Input | Default | Description |
| ---------------------------- | :--------: | ------------------------------------------- |
| Gap Type | Open/Close | Select gap detection method |
| Price Buffer (points) | 5.0 | Maximum distance for gap matching |
| Cluster Range (points) | 100.0 | Vertical distance within which levels merge |
| Line Width | 2 | Thickness of plotted lines |
| Days to Include | 14 | Number of days to retain past levels |
| Color for Levels Above Price | red | Line color when level > current price |
| Color for Levels Below Price | green | Line color when level < current price |
---
**How to Use**
1. **Add to Chart**: Apply on any intraday timeframe (1 min, 5 min, etc.).
2. **Select Mode**: Pick Open/Close or High/Low in settings.
3. **Tweak Inputs**: Raise/lower buffer for tighter/looser gap detection; adjust cluster range to group levels; change lookback (“Days to Include”) to control session reset.
4. **Interpret Levels**:
* **Green Lines** mark potential support zones.
* **Red Lines** mark potential resistance zones.
5. **Combine with Your Strategy**: Use alongside volume, momentum, or trend filters for confirmation.
---
**Tips & Tricks**
* **Intraday Entries**: Look for price reaction at green (support) lines for long setups, or red (resistance) lines for shorts.
* **Filter Noise**: Increase the “Cluster Range” to consolidate many close levels into stronger, singular lines.
---
**Disclaimer**
This indicator is provided “as-is” for educational purposes only. Always backtest any setup and practice proper risk management.

Ensemble Alerts█ OVERVIEW
This indicator creates highly customizable alert conditions and messages by combining several technical conditions into groups , which users can specify directly from the "Settings/Inputs" tab. It offers a flexible framework for building and testing complex alert conditions without requiring code modifications for each adjustment.
█ CONCEPTS
Ensemble analysis
Ensemble analysis is a form of data analysis that combines several "weaker" models to produce a potentially more robust model. In a trading context, one of the most prevalent forms of ensemble analysis is the aggregation (grouping) of several indicators to derive market insights and reinforce trading decisions. With this analysis, traders typically inspect multiple indicators, signaling trade actions when specific conditions or groups of conditions align.
Simplifying ensemble creation
Combining indicators into one or more ensembles can be challenging, especially for users without programming knowledge. It usually involves writing custom scripts to aggregate the indicators and trigger trading alerts based on the confluence of specific conditions. Making such scripts customizable via inputs poses an additional challenge, as it often involves complicated input menus and conditional logic.
This indicator addresses these challenges by providing a simple, flexible input menu where users can easily define alert criteria by listing groups of conditions from various technical indicators in simple text boxes . With this script, you can create complex alert conditions intuitively from the "Settings/Inputs" tab without ever writing or modifying a single line of code. This framework makes advanced alert setups more accessible to non-coders. Additionally, it can help Pine programmers save time and effort when testing various condition combinations.
█ FEATURES
Configurable alert direction
The "Direction" dropdown at the top of the "Settings/Inputs" tab specifies the allowed direction for the alert conditions. There are four possible options:
• Up only : The indicator only evaluates upward conditions.
• Down only : The indicator only evaluates downward conditions.
• Up and down (default): The indicator evaluates upward and downward conditions, creating alert triggers for both.
• Alternating : The indicator prevents alert triggers for consecutive conditions in the same direction. An upward condition must be the first occurrence after a downward condition to trigger an alert, and vice versa for downward conditions.
Flexible condition groups
This script features six text inputs where users can define distinct condition groups (ensembles) for their alerts. An alert trigger occurs if all the conditions in at least one group occur.
Each input accepts a comma-separated list of numbers with optional spaces (e.g., "1, 4, 8"). Each listed number, from 1 to 35, corresponds to a specific individual condition. Below are the conditions that the numbers represent:
1 — RSI above/below threshold
2 — RSI below/above threshold
3 — Stoch above/below threshold
4 — Stoch below/above threshold
5 — Stoch K over/under D
6 — Stoch K under/over D
7 — AO above/below threshold
8 — AO below/above threshold
9 — AO rising/falling
10 — AO falling/rising
11 — Supertrend up/down
12 — Supertrend down/up
13 — Close above/below MA
14 — Close below/above MA
15 — Close above/below open
16 — Close below/above open
17 — Close increase/decrease
18 — Close decrease/increase
19 — Close near Donchian top/bottom (Close > (Mid + HH) / 2)
20 — Close near Donchian bottom/top (Close < (Mid + LL) / 2)
21 — New Donchian high/low
22 — New Donchian low/high
23 — Rising volume
24 — Falling volume
25 — Volume above average (Volume > SMA(Volume, 20))
26 — Volume below average (Volume < SMA(Volume, 20))
27 — High body to range ratio (Abs(Close - Open) / (High - Low) > 0.5)
28 — Low body to range ratio (Abs(Close - Open) / (High - Low) < 0.5)
29 — High relative volatility (ATR(7) > ATR(40))
30 — Low relative volatility (ATR(7) < ATR(40))
31 — External condition 1
32 — External condition 2
33 — External condition 3
34 — External condition 4
35 — External condition 5
These constituent conditions fall into three distinct categories:
• Directional pairs : The numbers 1-22 correspond to pairs of opposing upward and downward conditions. For example, if one of the inputs includes "1" in the comma-separated list, that group uses the "RSI above/below threshold" condition pair. In this case, the RSI must be above a high threshold for the group to trigger an upward alert, and the RSI must be below a defined low threshold to trigger a downward alert.
• Non-directional filters : The numbers 23-30 correspond to conditions that do not represent directional information. These conditions act as filters for both upward and downward alerts. Traders often use non-directional conditions to refine trending or mean reversion signals. For instance, if one of the input lists includes "30", that group uses the "Low relative volatility" condition. The group can trigger an upward or downward alert only if the 7-period Average True Range (ATR) is below the 40-period ATR.
• External conditions : The numbers 31-35 correspond to external conditions based on the plots from other indicators on the chart. To set these conditions, use the source inputs in the "External conditions" section near the bottom of the "Settings/Inputs" tab. The external value can represent an upward, downward, or non-directional condition based on the following logic:
▫ Any value above 0 represents an upward condition.
▫ Any value below 0 represents a downward condition.
▫ If the checkbox next to the source input is selected, the condition becomes non-directional . Any group that uses the condition can trigger upward or downward alerts only if the source value is not 0.
To learn more about using plotted values from other indicators, see this article in our Help Center and the Source input section of our Pine Script™ User Manual.
Group markers
Each comma-separated list represents a distinct group , where all the listed conditions must occur to trigger an alert. This script assigns preset markers (names) to each condition group to make the active ensembles easily identifiable in the generated alert messages and labels. The markers assigned to each group use the format "M", where "M" is short for "Marker" and "x" is the group number. The titles of the inputs at the top of the "Settings/Inputs" tab show these markers for convenience.
For upward conditions, the labels and alert messages show group markers with upward triangles (e.g., "M1▲"). For downward conditions, they show markers with downward triangles (e.g., "M1▼").
NOTE: By default, this script populates the "M1" field with a pre-configured list for a mean reversion group ("2,18,24,28"). The other fields are empty. If any "M*" input does not contain a value, the indicator ignores it in the alert calculations.
Custom alert messages
By default, the indicator's alert message text contains the activated markers and their direction as a comma-separated list. Users can override this message for upward or downward alerts with the two text fields at the bottom of the "Settings/Inputs" tab. When the fields are not empty , the alerts use that text instead of the default marker list.
NOTE: This script generates alert triggers, not the alerts themselves. To set up an alert based on this script's conditions, open the "Create Alert" dialog box, then select the "Ensemble Alerts" and "Any alert() function call" options in the "Condition" tabs. See the Alerts FAQ in our Pine Script™ User Manual for more information.
Condition visualization
This script offers organized visualizations of its conditions, allowing users to inspect the behaviors of each condition alongside the specified groups. The key visual features include:
1) Conditional plots
• The indicator plots the history of each individual condition, excluding the external conditions, as circles at different levels. Opposite conditions appear at positive and negative levels with the same absolute value. The plots for each condition show values only on the bars where they occur.
• Each condition's plot is color-coded based on its type. Aqua and orange plots represent opposing directional conditions, and purple plots represent non-directional conditions. The titles of the plots also contain the condition numbers to which they apply.
• The plots in the separate pane can be turned on or off with the "Show plots in pane" checkbox near the top of the "Settings/Inputs" tab. This input only toggles the color-coded circles, which reduces the graphical load. If you deactivate these visuals, you can still inspect each condition from the script's status line and the Data Window.
• As a bonus, the indicator includes "Up alert" and "Down alert" plots in the Data Window, representing the combined upward and downward ensemble alert conditions. These plots are also usable in additional indicator-on-indicator calculations.
2) Dynamic labels
• The indicator draws a label on the main chart pane displaying the activated group markers (e.g., "M1▲") each time an alert condition occurs.
• The labels for upward alerts appear below chart bars. The labels for downward alerts appear above the bars.
NOTE: This indicator can display up to 500 labels because that is the maximum allowed for a single Pine script.
3) Background highlighting
• The indicator can highlight the main chart's background on bars where upward or downward condition groups activate. Use the "Highlight background" inputs in the "Settings/Inputs" tab to enable these highlights and customize their colors.
• Unlike the dynamic labels, these background highlights are available for all chart bars, irrespective of the number of condition occurrences.
█ NOTES
• This script uses Pine Script™ v6, the latest version of TradingView's programming language. See the Release notes and Migration guide to learn what's new in v6 and how to convert your scripts to this version.
• This script imports our new Alerts library, which features functions that provide high-level simplicity for working with complex compound conditions and alerts. We used the library's `compoundAlertMessage()` function in this indicator. It evaluates items from "bool" arrays in groups specified by an array of strings containing comma-separated index lists , returning a tuple of "string" values containing the marker of each activated group.
• The script imports the latest version of the ta library to calculate several technical indicators not included in the built-in `ta.*` namespace, including Double Exponential Moving Average (DEMA), Triple Exponential Moving Average (TEMA), Fractal Adaptive Moving Average (FRAMA), Tilson T3, Awesome Oscillator (AO), Full Stochastic (%K and %D), SuperTrend, and Donchian Channels.
• The script uses the `force_overlay` parameter in the label.new() and bgcolor() calls to display the drawings and background colors in the main chart pane.
• The plots and hlines use the available `display.*` constants to determine whether the visuals appear in the separate pane.
Look first. Then leap.

Alerts█ OVERVIEW
This library is a Pine Script™ programmers tool that provides functions to simplify the creation of compound conditions and alert messages. With these functions, scripts can use comma-separated "string" lists to specify condition groups from arbitrarily large "bool" arrays , offering a convenient way to provide highly flexible alert creation to script users without requiring numerous inputs in the "Settings/Inputs" menu.
█ CONCEPTS
Compound conditions
Compound conditions are essentially groups of two or more conditions, where each required condition must occur to produce a `true` result. Traders often combine conditions, including signals from various indicators, to drive and reinforce trade decisions. Similarly, programmers use compound conditions in logical operations to create scripts that respond dynamically to groups of events.
Condition conundrum
Providing flexible condition combinations to script users for signals and alerts often poses a significant challenge: input complexity . Conventionally, such flexibility comes at the cost of an extensive list of separate inputs for toggling individual conditions and customizing their properties, often resulting in complicated input menus that are difficult for users to navigate effectively. Furthermore, managing all those inputs usually entails tediously handling many extra variables and logical expressions, making such projects more complex for programmers.
Condensing complexity
This library introduces a technique using parsed strings to reference groups of elements from "bool" arrays , helping to simplify and streamline the construction of compound conditions and alert messages. With this approach, programmers can provide one or more "string" inputs in their scripts where users can list numbers corresponding to the conditions they want to combine.
For example, suppose you have a script that creates alert triggers based on a combination of up to 20 individual conditions, and you want to make inputs for users to choose which conditions to combine. Instead of creating 20 separate checkboxes in the "Settings/Inputs" tab and manually adding associated logic for each one, you can store the conditional values in arrays, make one or more "string" inputs that accept values listing the array item locations (e.g., "1,4,8,11"), and then pass the inputs to these functions to determine the compound conditions formed by the specified groups.
This approach condenses the input space, improving navigability and utility. Additionally, it helps provide high-level simplicity to complex conditional code, making it easier to maintain and expand over time.
█ CALCULATIONS AND USE
This library contains three functions for evaluating compound conditions: `getCompoundConditon()`, `getCompoundConditionsArray()`, and `compoundAlertMessage()`. Each function has two overloads that evaluate compound conditions based on groups of items from one or two "bool" arrays . The sections below explain the functions' calculations and how to use them.
Referencing conditions using "string" index lists
Each function processes "string" values containing comma-separated lists of numerals representing the indices of the "bool" array items to use in its calculations (e.g., "4, 8, 12"). The functions split each supplied "string" list by its commas, then iterate over those specified indices in the "bool" arrays to determine each group's combined `true` or `false` state.
For convenience, the numbers in the "string" lists can represent zero-based indices (where the first item is at index 0) or one-based indices (where the first item is at index 1), depending on the function's `zeroIndex` parameter. For example, an index list of "0, 2, 4" with a `zeroIndex` value of `true` specifies that the condition group uses the first , third , and fifth "bool" values in the array, ignoring all others. If the `zeroIndex` value is `false`, the list "1, 3, 5" also refers to those same elements.
Zero-based indexing is convenient for programmers because Pine arrays always use this index format. However, one-based indexing is often more convenient and familiar for script users, especially non-programmers.
Evaluating one or many condition groups
The `getCompoundCondition()` function evaluates singular condition groups determined by its `indexList` parameter, returning `true` values whenever the specified array elements are `true`. This function is helpful when a script has to evaluate specific groups of conditions and does not require many combinations.
In contrast, the `getCompoundConditionsArray()` function can evaluate numerous condition groups, one for each "string" included in its `indexLists` argument. It returns arrays containing `true` or `false` states for each listed group. This function is helpful when a script requires multiple condition combinations in additional calculations or logic.
The `compoundAlertMessage()` function is similar to the `getCompoundConditionsArray()` function. It also evaluates a separate compound condition group for each "string" in its `indexLists` array, but it returns "string" values containing the marker (name) of each group with a `true` result. You can use these returned values as the `message` argument in alert() calls, display them in labels and other drawing objects, or even use them in additional calculations and logic.
Directional condition pairs
The first overload of each function operates on a single `conditions` array, returning values representing one or more compound conditions from groups in that array. These functions are ideal for general-purpose condition groups that may or may not represent direction information.
The second overloads accept two arrays representing upward and downward conditions separately: `upConditions` and `downConditions`. These overloads evaluate opposing directional conditions in pairs (e.g., RSI is above/below a level) and return upward and downward condition information separately in a tuple .
When using the directional overloads, ensure the `upConditions` and `downConditions` arrays are the same size, with the intended condition pairs at the same indices . For instance, if you have a specific upward RSI condition's value at the first index in the `upConditions` array, include the opposing downward RSI condition's value at that same index in the `downConditions` array. If a condition can apply to both directions (e.g., rising volume), include its value at the same index in both arrays.
Group markers
To simplify the generation of informative alert messages, the `compoundAlertMessage()` function assigns "string" markers to each condition group, where "marker" refers to the group's name. The `groupMarkers` parameter allows you to assign custom markers to each listed group. If not specified, the function generates default group markers in the format "M", where "M" is short for "Marker" and "" represents the group number starting from 1. For example, the default marker for the first group specified in the `indexLists` array is "M1".
The function's returned "string" values contain a comma-separated list with markers for each activated condition group (e.g., "M1, M4"). The function's second overload, which processes directional pairs of conditions, also appends extra characters to the markers to signify the direction. The default for upward groups is "▲" (e.g., "M1▲") and the default for downward ones is "▼" (e.g., "M1▼"). You can customize these appended characters with the `upChar` and `downChar` parameters.
Designing customizable alerts
We recommend following these primary steps when using this library to design flexible alerts for script users:
1. Create text inputs for users to specify comma-separated lists of conditions with the input.string() or input.text_area() functions, and then collect all the input values in a "string" array . Note that each separate "string" in the array will represent a distinct condition group.
2. Create arrays of "bool" values representing the possible conditions to choose from. If your script will process pairs of upward and downward conditions, ensure the related elements in the arrays align at the same indices.
3. Call `compoundAlertMessage()` using the arrays from steps 1 and 2 as arguments to get the alert message text. If your script will use the text for alerts only, not historical display or calculation purposes, the call is necessary only on realtime bars .
4. Pass the calculated "string" values as the `message` argument in alert() calls. We recommend calling the function only when the "string" is not empty (i.e., `messageText != ""`). To avoid repainting alerts on open bars, use barstate.isconfirmed in the condition to allow alert triggers only on each bar's close .
5. Test the alerts. Open the "Create Alert" dialog box and select "Any alert() function call" in the "Condition" field. It is also helpful to inspect the strings with Pine Logs .
NOTE: Because the techniques in this library use lists of numbers to specify conditions, we recommend including a tooltip for the "string" inputs that lists the available numbers and the conditions they represent. This tooltip provides a legend for script users, making it simple to understand and utilize. To create the tooltip, declare a "const string" listing the options and pass it to the `input.*()` call's `tooltip` parameter. See the library's example code for a simple demonstration.
█ EXAMPLE CODE
This library's example code demonstrates one possible way to offer a selection of compound conditions with "string" inputs and these functions. It uses three input.string() calls, each accepting a comma-separated list representing a distinct condition group. The title of each input represents the default group marker that appears in the label and alert text. The code collects these three input values in a `conditionGroups` array for use with the `compoundAlertMessage()` function.
In this code, we created two "bool" arrays to store six arbitrary condition pairs for demonstration:
1. Bar up/down: The bar's close price must be above the open price for upward conditions, and vice versa for downward conditions.
2. Fast EMA above/below slow EMA : The 9-period Exponential Moving Average of close prices must be above the 21-period EMA for upward conditions, and vice versa for downward conditions.
3. Volume above average : The bar's volume must exceed its 20-bar average to activate an upward or downward condition.
4. Volume rising : The volume must exceed that of the previous bar to activate an upward or downward condition.
5. RSI trending up/down : The 14-period Relative Strength Index of close prices must be between 50 and 70 for upward conditions, and between 30 and 50 for downward conditions.
6. High volatility : The 7-period Average True Range (ATR) must be above the 40-period ATR to activate an upward or downward condition.
We included a `tooltip` argument for the third input.string() call that displays the condition numbers and titles, where 1 is the first condition number.
The `bullConditions` array contains the `true` or `false` states of all individual upward conditions, and the `bearConditions` array contains all downward condition states. For the conditions that filter either direction because they are non-directional, such as "High volatility", both arrays contain the condition's `true` or `false` value at the same index. If you use these conditions alone, they activate upward and downward alert conditions simultaneously.
The example code calls `compoundAlertMessage()` using the `bullConditions`, `bearConditions`, and `conditionGroups` arrays to create a tuple of strings containing the directional markers for each activated group. On confirmed bars, it displays non-empty strings in labels and uses them in alert() calls. For the text shown in the labels, we used str.replace_all() to replace commas with newline characters, aligning the markers vertically in the display.
Look first. Then leap.
█ FUNCTIONS
This library exports the following functions:
getCompoundCondition(conditions, indexList, minRequired, zeroIndex)
(Overload 1 of 2) Determines a compound condition based on selected elements from a `conditions` array.
Parameters:
conditions (array) : (array) An array containing the possible "bool" values to use in the compound condition.
indexList (string) : (series string) A "string" containing a comma-separated list of whole numbers representing the group of `conditions` elements to use in the compound condition. For example, if the value is `"0, 2, 4"`, and `minRequired` is `na`, the function returns `true` only if the `conditions` elements at index 0, 2, and 4 are all `true`. If the value is an empty "string", the function returns `false`.
minRequired (int) : (series int) Optional. Determines the minimum number of selected conditions required to activate the compound condition. For example, if the value is 2, the function returns `true` if at least two of the specified `conditions` elements are `true`. If the value is `na`, the function returns `true` only if all specified elements are `true`. The default is `na`.
zeroIndex (bool) : (series bool) Optional. Specifies whether the `indexList` represents zero-based array indices. If `true`, a value of "0" in the list represents the first array index. If `false`, a `value` of "1" represents the first index. The default is `true`.
Returns: (bool) `true` if `conditions` elements in the group specified by the `indexList` are `true`, `false` otherwise.
getCompoundCondition(upConditions, downConditions, indexList, minRequired, allowUp, allowDown, zeroIndex)
(Overload 2 of 2) Determines upward and downward compound conditions based on selected elements from `upConditions` and `downConditions` arrays.
Parameters:
upConditions (array) : (array) An array containing the possible "bool" values to use in the upward compound condition.
downConditions (array) : (array) An array containing the possible "bool" values to use in the downward compound condition.
indexList (string) : (series string) A "string" containing a comma-separated list of whole numbers representing the `upConditions` and `downConditions` elements to use in the compound conditions. For example, if the value is `"0, 2, 4"` and `minRequired` is `na`, the function returns `true` for the first value only if the `upConditions` elements at index 0, 2, and 4 are all `true`. If the value is an empty "string", the function returns ` `.
minRequired (int) : (series int) Optional. Determines the minimum number of selected conditions required to activate either compound condition. For example, if the value is 2, the function returns `true` for its first value if at least two of the specified `upConditions` elements are `true`. If the value is `na`, the function returns `true` only if all specified elements are `true`. The default is `na`.
allowUp (bool) : (series bool) Optional. Controls whether the function considers upward compound conditions. If `false`, the function ignores the `upConditions` array, and the first item in the returned tuple is `false`. The default is `true`.
allowDown (bool) : (series bool) Optional. Controls whether the function considers downward compound conditions. If `false`, the function ignores the `downConditions` array, and the second item in the returned tuple is `false`. The default is `true`.
zeroIndex (bool) : (series bool) Optional. Specifies whether the `indexList` represents zero-based array indices. If `true`, a value of "0" in the list represents the first array index. If `false`, a value of "1" represents the first index. The default is `true`.
Returns: ( ) A tuple containing two "bool" values representing the upward and downward compound condition states, respectively.
getCompoundConditionsArray(conditions, indexLists, zeroIndex)
(Overload 1 of 2) Creates an array of "bool" values representing compound conditions formed by selected elements from a `conditions` array.
Parameters:
conditions (array) : (array) An array containing the possible "bool" values to use in each compound condition.
indexLists (array) : (array) An array of strings containing comma-separated lists of whole numbers representing the `conditions` elements to use in each compound condition. For example, if an item is `"0, 2, 4"`, the corresponding item in the returned array is `true` only if the `conditions` elements at index 0, 2, and 4 are all `true`. If an item is an empty "string", the item in the returned array is `false`.
zeroIndex (bool) : (series bool) Optional. Specifies whether the "string" lists in the `indexLists` represent zero-based array indices. If `true`, a value of "0" in a list represents the first array index. If `false`, a value of "1" represents the first index. The default is `true`.
Returns: (array) An array of "bool" values representing compound condition states for each condition group. An item in the array is `true` only if all the `conditions` elements specified by the corresponding `indexLists` item are `true`. Otherwise, the item is `false`.
getCompoundConditionsArray(upConditions, downConditions, indexLists, allowUp, allowDown, zeroIndex)
(Overload 2 of 2) Creates two arrays of "bool" values representing compound upward and
downward conditions formed by selected elements from `upConditions` and `downConditions` arrays.
Parameters:
upConditions (array) : (array) An array containing the possible "bool" values to use in each upward compound condition.
downConditions (array) : (array) An array containing the possible "bool" values to use in each downward compound condition.
indexLists (array) : (array) An array of strings containing comma-separated lists of whole numbers representing the `upConditions` and `downConditions` elements to use in each compound condition. For example, if an item is `"0, 2, 4"`, the corresponding item in the first returned array is `true` only if the `upConditions` elements at index 0, 2, and 4 are all `true`. If an item is an empty "string", the items in both returned arrays are `false`.
allowUp (bool) : (series bool) Optional. Controls whether the function considers upward compound conditions. If `false`, the function ignores the `upConditions` array, and all elements in the first returned array are `false`. The default is `true`.
allowDown (bool) : (series bool) Optional. Controls whether the function considers downward compound conditions. If `false`, the function ignores the `downConditions` array, and all elements in the second returned array are `false`. The default is `true`.
zeroIndex (bool) : (series bool) Optional. Specifies whether the "string" lists in the `indexLists` represent zero-based array indices. If `true`, a value of "0" in a list represents the first array index. If `false`, a value of "1" represents the first index. The default is `true`.
Returns: ( ) A tuple containing two "bool" arrays:
- The first array contains values representing upward compound condition states determined using the `upConditions`.
- The second array contains values representing downward compound condition states determined using the `downConditions`.
compoundAlertMessage(conditions, indexLists, zeroIndex, groupMarkers)
(Overload 1 of 2) Creates a "string" message containing a comma-separated list of markers representing active compound conditions formed by specified element groups from a `conditions` array.
Parameters:
conditions (array) : (array) An array containing the possible "bool" values to use in each compound condition.
indexLists (array) : (array) An array of strings containing comma-separated lists of whole numbers representing the `conditions` elements to use in each compound condition. For example, if an item is `"0, 2, 4"`, the corresponding marker for that item appears in the returned "string" only if the `conditions` elements at index 0, 2, and 4 are all `true`.
zeroIndex (bool) : (series bool) Optional. Specifies whether the "string" lists in the `indexLists` represent zero-based array indices. If `true`, a value of "0" in a list represents the first array index. If `false`, a value of "1" represents the first index. The default is `true`.
groupMarkers (array) : (array) Optional. If specified, sets the marker (name) for each condition group specified in the `indexLists` array. If `na`, the function uses the format `"M"` for each group, where "M" is short for "Marker" and `` represents the one-based index for the group (e.g., the marker for the first listed group is "M1"). The default is `na`.
Returns: (string) A "string" containing a list of markers corresponding to each active compound condition.
compoundAlertMessage(upConditions, downConditions, indexLists, allowUp, allowDown, zeroIndex, groupMarkers, upChar, downChar)
(Overload 2 of 2) Creates two "string" messages containing comma-separated lists of markers representing active upward and downward compound conditions formed by specified element groups from `upConditions` and `downConditions` arrays.
Parameters:
upConditions (array) An array containing the possible "bool" values to use in each upward compound condition.
downConditions (array) An array containing the possible "bool" values to use in each downward compound condition.
indexLists (array) An array of strings containing comma-separated lists of whole numbers representing the `upConditions` and `downConditions` element groups to use in each compound condition. For example, if an item is `"0, 2, 4"`, the corresponding group marker for that item appears in the first returned "string" only if the `upConditions` elements at index 0, 2, and 4 are all `true`.
allowUp (bool) Optional. Controls whether the function considers upward compound conditions. If `false`, the function ignores the `upConditions` array and returns an empty "string" for the first tuple element. The default is `true`.
allowDown (bool) Optional. Controls whether the function considers downward compound conditions. If `false`, the function ignores the `downConditions` array and returns an empty "string" for the second tuple element. The default is `true`.
zeroIndex (bool) Optional. Specifies whether the "string" lists in the `indexLists` represent zero-based array indices. If `true`, a value of "0" in a list represents the first array index. If `false`, a value of "1" represents the first index. The default is `true`.
groupMarkers (array) Optional. If specified, sets the name (marker) of each condition group specified in the `indexLists` array. If `na`, the function uses the format `"M"` for each group, where "M" is short for "Marker" and `` represents the one-based index for the group (e.g., the marker for the first listed group is "M1"). The default is `na`.
upChar (string) Optional. A "string" appended to all group markers for upward conditions to signify direction. The default is "▲".
downChar (string) Optional. A "string" appended to all group markers for downward conditions to signify direction. The default is "▼".
Returns: ( ): A tuple of "string" values containing lists of markers corresponding to active upward and downward compound conditions, respectively.

SMC Community [algoat] — Smart Money ConceptsEmpower your trading with the core principles of the Smart Money Concepts through interactive features and highly customizable settings.
The indicator's strength lies in the unique SMC Core algorithm, a calculation based on real price action data, capturing every tick from small intraday fluctuations to significant high timeframe movements.
algoat SMC Core is our continually evolving, specialized structure mapping algorithm, serving as the backbone of our price action related publications.
⭐ Key Features
Swing Market Structure: Change of Character, Break of Structure
Recognize and visualize real-time market structures with swing elements. Identify and mark key structural changes in the market to visually highlight shifts in market trends and patterns. This feature is designed to alert you to significant changes in the market's behavior, signaling a potential shift from accumulation to distribution phases, or vice versa. It helps traders adapt their strategies based on evolving market dynamics.
Order Flow: Structure Fractal
Connect the successive structural high and low levels, visualizing the intricate flow of market movements. This feature highlights fractal structures within the market, enabling traders to detect significant price action patterns.
Structure Range: Determine Discount, Premium, and Equilibrium Zones
This feature provides a unique way of visualizing price areas where a security could be overbought or oversold (premium or discount zones) and where the price is expected to be fair and balanced (equilibrium zone). Distance from the current price is displayed in percentage terms, which can assist traders with crucial data for risk management and strategic planning. The Range function helps you identify the most favorable price zones for entries and set your stop-loss and take-profit levels more accurately.
Liquidity Grabs: Reveal Hidden Manipulation Attempts
Identify uncovered market areas where high liquidity trading may take place. Liquidity Grabs help track "smart money" footprints by identifying levels where large institutional traders may have induced liquidity traps. Understanding these traps can aid in avoiding false market moves and optimizing trade entries.
Institutional Interest Zones: Order Blocks and Fair Value Gaps
Uncover areas where bigger orders may be lined up. Reveal zones of interest ordered by volume strength. Receive warnings about market price imbalances.
▸ Order Blocks pinpoint crucial zones where large institutional investors ("smart money") have shown strong buying or selling interest recently. These blocks can serve as a tool for identifying key areas for potential trade entries or exits.
▸ Fair Value Gaps detect discrepancies between the perceived market value and the actual market price, revealing potential areas for price correction. With its mitigation settings, you can fine-tune the FVG detection according to the magnitude of value misalignment you consider significant.
Mitigation types dictate how price interacts with a zone, with order blocks requiring a close through (indicating stronger price movement) and fair value gaps requiring a wick through (hinting at weak rejection).
══════════════════
⭐ Why SMC?
In the ever-evolving trading landscape, mainstream methods and strategies can quickly become outdated as they are widely adopted. Liquidity is constantly sought after, and the best source for this is exploring and exploiting trading strategies that are widely accepted and applied. Currently, one of these strategies is the SMC (Supply, Demand, and Price Action).
It's no coincidence that our educational materials incorporate concepts such as liquidity grabs (LG) and Smart Money Traps (SMT). As the application of SMC gains popularity among retail traders, trading with this approach becomes more challenging. Therefore, the recent focus has been on reforming the SMC methodology, as it is the only method that relies on real price movements and will always work when applied correctly.
The indicator reflects our personal use and deep comprehension of Smart Money Concepts. It provides streamlined tools for tracking algorithmic trends with modern visualizations, without unnecessary clutter.
▸ What does the proper application of SMC entail?
Many SMC traders associate their key areas of interest with the market structure, which is generally considered acceptable. However, depending solely on a single foundation can lead to significant deviations, which may cause notable impacts on trading results. Moreover, if the basis for the market structure calculation is inaccurate, the consequences can be even more severe. It's akin to risking money on a lottery ticket, believing it will be a winner.
Our methodology is different, and it may ensure longevity in the financial markets. The structure remains crucial, but it is not the sole foundation of everything; instead, it serves as a validation tool. Each calculation, such as order blocks (OB), Fair Value Gaps (FVG), liquidity grabs (LG), range analysis, and more, is independent and unique, separate from the structure. However, validation must ultimately come from the structure itself.
We employ individual and high-quality filters: before a function calculation is validated by the structure, it must undergo rigorous testing based on its own set of validation conditions. This approach aims to enhance robustness and accuracy, providing traders with a reliable framework for making informed trading decisions.
▸ An example of structure validation: Order Block with "Swing Sensitivity"
These order blocks will only be displayed and utilized by the script if there is a swing structure validation with a valid break. In other words, the presence of a confirmed swing Change of Character (ChoCh) or Break of Structure (BoS) is essential for the Order Block to be considered valid and relevant.
This approach ensures that the order blocks are aligned with the overall market structure and are not based on isolated or unreliable price movements. Whether it's Fair Value Gaps (FVG), Liquidity Grabs (LG), Range calculations, or other functionalities, the same underlying principle holds true. The background structure calculation serves as a validation mechanism for the data and insights generated by these functions, ensuring they adhere to the specific criteria and rules established within our methodology. By incorporating this robust validation process, traders can have confidence in the reliability and accuracy of the information provided by the indicator, allowing them to make informed trading decisions based on validated data and analysis.
══════════════════
👉 Usage - the general approach
Determine your trading style and build your basic strategy:
The indicator helps you understand your trading style, whether it's swing trading, scalping or another approach. By analyzing the SMC indicator, you gain valuable information about potential market trends, entry and exit points, and overall market sentiment.
Steps:
Identify Trading Style: Determine whether you are a swing trader, scalper, or long-term investor. This will influence how you use the indicator.
Analyze Market Trends: Use the SMC indicator to observe market trends and identify potential entry and exit points.
Adapt Strategies: Adjust your strategies based on the market dynamics revealed by the SMC indicator, such as changes in order flow or market structure.
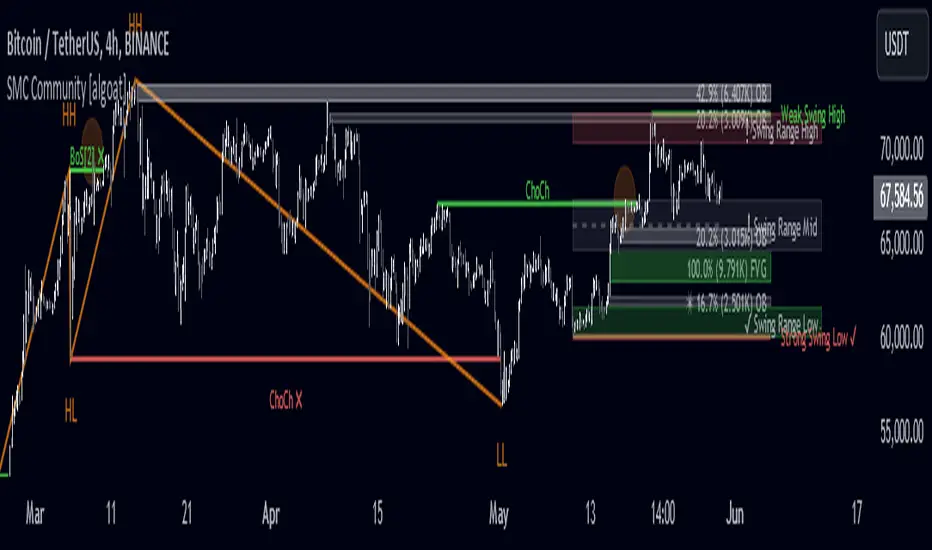
👉 Example of usage
In the following chart, you'll notice how we've utilized the indicator to formulate a strategic trading approach. We've employed Order Blocks equipped with volume parameters to identify crucial market zones. Simultaneously, we've leveraged swing/internal market structures to gain insights into potential long- and short-term market turnarounds. Lastly, we've examined trend line liquidity zones to pinpoint probable impulses and breakouts within ongoing trends.
Now we can see how the price descended to the order block with the highest volume, which we had previously marked as our point of interest for an entry. As the price closed below the median Order Block, we noted its mitigation. After an internal CHoCH, it's directing us towards the main Order Block as a target.
══════════════════
🧠 General advice
Trading effectively requires a range of techniques, experience, and expertise. From technical analysis to market fundamentals, traders must navigate multiple factors, including market sentiment and economic conditions. However, traders often find themselves overwhelmed by market noise, making it challenging to filter out distractions and make informed decisions. By integrating multiple analytical approaches, traders can tailor their strategies to fit their unique trading styles and objectives.
Confirming signals with other indicators
As with all technical indicators, it is important to confirm potential signals with other analytical tools, such as support and resistance levels, as well as indicators like RSI, MACD, and volume. This helps increase the probability of a successful trade.
Use proper risk management
When using this or any other indicator, it is crucial to have proper risk management in place. Consider implementing stop-loss levels and thoughtful position sizing.
Combining with other technical indicators
Integrate this indicator with other technical indicators to develop a comprehensive trading strategy and provide additional confirmation.
Conduct Thorough Research and Backtesting
Ensure a solid understanding of the indicator and its behavior through thorough research and backtesting before making trading decisions. Consider incorporating fundamental analysis and market sentiment into your trading approach.
══════════════════
⭐ Conclusion
We hold the view that the true path to success is the synergy between the trader and the tool, contrary to the common belief that the tool itself is the sole determinant of profitability. The actual scenario is more nuanced than such an oversimplification. A word to the wise is enough: developed by traders, for traders — pioneering innovations for the modern era.
Risk Notice
Everything provided by algoat — from scripts, tools, and articles to educational materials — is intended solely for educational and informational purposes. Past performance does not assure future returns.
Sticky Notes, Checklist, To-do, Journal [algoat]I forgot to bring my notes again...
Ever feel like your trading notes are all over the place, much like your portfolio after a market dip? Worry not! With this script, you'll have all your trading notes, tasks, and brilliant (or not so brilliant) ideas neatly organized right on your chart. It's like having a sticky note board, but way cooler and without the risk of paper cuts.
⭐ Features :
To-Do Lists
Keep track of tasks with satisfying checkmarks for those dopamine hits.
Journal Entries
Document your market insights, trade plans, or just random thoughts. "I forgot something" – we've all been there.
Due Dates
Never miss an important deadline again. Red alert for overdue tasks because procrastination is a trader's worst enemy.
Customization
Choose the size and position of your notes because one size doesn't fit all.
Perfect for the organized trader who loves a bit of fun or the chaotic one who needs a bit of structure. Embrace the power of notes and stay on top of your trading game!
══════════════════
🧠 General advice
Trading effectively requires a range of techniques, experience, and expertise. From technical analysis to market fundamentals, traders must navigate multiple factors, including market sentiment and economic conditions. However, traders often find themselves overwhelmed by market noise, making it challenging to filter out distractions and make informed decisions. By integrating multiple analytical approaches, traders can tailor their strategies to fit their unique trading styles and objectives.
Confirming Signals with other indicators
As with all technical indicators, it is important to confirm potential signals with other analytical tools, such as support and resistance levels, as well as indicators like RSI, MACD, and volume. This helps increase the probability of a successful trade.
Use proper risk management
When using this or any other indicator, it is crucial to have proper risk management in place. Consider implementing stop-loss levels and thoughtful position sizing.
Combining with other technical indicators
The indicator can be effectively used alongside other technical indicators to create a comprehensive trading strategy and provide additional confirmation.
Keep in mind
Thorough research and backtesting are essential before making any trading decisions. Furthermore, it's crucial to have a solid understanding of the indicator and its behavior. Additionally, incorporating fundamental analysis and considering market sentiment can be vital factors to take into account in your trading approach.
══════════════════
⭐ Conclusion
We hold the view that the true path to success is the synergy between the trader and the tool, contrary to the common belief that the tool itself is the sole determinant of profitability. The actual scenario is more nuanced than such an oversimplification. A word to the wise is enough: developed by traders, for traders — pioneering innovations for the modern era.
Risk Notice
Everything provided by algoat — from scripts, tools, and articles to educational materials — is intended solely for educational and informational purposes. Past performance does not assure future returns.

FreedX Grid Backtest█ FreedX Grid Backtest is an open-source tool that offers accurate GRID calculations for GRID trading strategies. This advanced tool allows users to backtest GRID trading parameters with precision, accurately reflecting exchange functionalities. We are committed to enhancing trading strategies through precise backtesting solutions and address the issue of unreliable backtesting practices observed on GRID trading strategies. FreedX Grid Backtest is designed for optimal calculation speed and plotting efficiency, ensuring users to achieve fastest calculations during their analysis.
█ GRID TRADING STRATEGY SETTINGS
The core of the FreedX Grid Backtest tool lies in its ability to simulate grid trading strategies. Grid trading involves placing orders at regular intervals within a predefined price range, creating a grid of orders that capitalize on market volatility.
Features:
⚙️ Backtest Range:
→ Purpose: Allows users to specify the backtesting range of GRID strategy. Closes all positions at the end of this range.
→ How to Use: Drag the dates to fit the desired backtesting range.
⚙️ Investment & Compounding:
→ Purpose: Allows users to specify the total investment amount and select between fixed and compound investment strategies. Compounding adjusts trade quantities based on performance, enhancing the grid strategy's adaptability to market changes.
→ How to Use: Set the desired investment amount and choose between "Fixed" or "Compound" for the investment method.
⚙️ Leverage & Grid Levels:
→ Purpose: Leverage amplifies the investment amount, increasing potential returns (and risks). Users can define the number of grid levels, which determines how the investment is distributed across the grid.
→ How to Use: Input the desired leverage and number of grids. The tool automatically calculates the distribution of funds across each grid level.
⚙️ Distribution Type & Mode:
→ Purpose: Users can select the distribution type (Arithmetic or Geometric) to set how grid levels are determined. The mode (Neutral, Long, Short) dictates the direction of trades within the grid.
→ How to Use: Choose the distribution type and mode based on the desired trading strategy and market outlook.
⚙️ Enable LONG/SHORT Grids exclusively:
█ MANUAL LEVELS AND STOP TRIGGERS
Beyond automated settings, the tool offers manual adjustments for traders seeking finer control over their grid strategies.
Features:
⚙️ Manual Level Adjustment:
→ Purpose: Enables traders to manually set the top, reference, and bottom levels of the grid, offering precision control over the trading range.
→ How to Use: Activate manual levels and adjust the top, reference, and bottom levels as needed to define the grid's scope.
⚙️ Stop Triggers:
→ Purpose: Provides an option to set upper and lower price limits, acting as stop triggers to close or terminate trades. This feature safeguards investments against significant market movements outside the anticipated range.
→ How to Use: Enable stop triggers and specify the upper and lower limits. The tool will automatically manage positions based on these parameters.
---
This guide gives you a quick and clear overview of the FreedX Grid Backtest tool, explaining how you can use this cutting-edge tool to improve your trading strategies.

FreedX Backtest Plus█ Our new FreedX Backtest PLUS template enhances TradingView backtesting with smart features like Mean Reversion, Flexible Volatility, Liquidation Filter, and Better Trend Filtering, making strategies more effective. It lets users set up automated alerts easily. This guide explains how to make the most of these improved features.
The Trading Date Settings feature in our TradingView script allows you to refine their backtesting parameters by specifying trading dates and hours. This feature enhances the accuracy of the backtest by aligning it with specific time frames and days, ensuring that the strategy is tested under relevant market conditions.
Features:
⚙️ Enable Trading Between Specific Dates:
🎯 Purpose:
→ Allows you to limit the backtesting of their strategy to a specific date range.
💡 How to Use:
→ Input the Start Date and End Date for the backtest period.
→ The script will execute the strategy only within this specified date range.
⚙️ Enable Trading Between Specific Hours:
🎯 Purpose:
→ Allows you to limit the backtesting of their strategy to a specific hour range.
💡 How to Use:
→ Input the start and end hour for in Trading Session section.
→ The script will execute the strategy only within this specified hour range.
⚙️ Enable Trading on Specified Days of the Week:
🎯 Purpose:
→ Gives you the option to conduct backtesting on selected days of the week, tailoring the strategy to particular market behaviours that may occur on these days.
💡 How to Use:
→ Select the days of the week for the backtest.
→ The script will activate the trading strategy only on these chosen days.
█ BUY/SELL TRIGGER SETTINGS
The Buy/Sell Trigger Settings feature is designed to provide users with flexibility in defining the conditions for 'LONG' and 'SHORT' signals based on various indicator types. This customization is crucial for tailoring strategies to different trading styles and market conditions.
Features:
⚙️ Single-Line Plotted Indicators :
🎯 Purpose:
→ Enables you to select a single-line plotted indicator as a source for backtesting. You can define specific levels to trigger 'LONG' or 'SHORT' signals.
💡 How to Use:
→ Choose a Single-Line Plotted indicator as the source.
→ Set the top and bottom levels for the indicator.
→ The script triggers 'LONG' signals at the bottom level and 'SHORT' signals at the top level.
⚙️ Two-Line Plotted Indicators :
🎯 Purpose:
→ Allows backtesting with two-line cross plot sources. Signals are generated based on the crossover of these lines.
💡 How to Use:
→ Select two lines as 'Source 1' and 'Source 2' for the indicator.
→ The script triggers a 'LONG' signal when 'Source 1' crosses above 'Source 2'.
→ Conversely, a 'SHORT' signal is triggered when 'Source 2' crosses above 'Source 1'.
⚙️ Custom Signals :
🎯 Purpose:
→ This setting enables users to define their own criteria for LONG, SHORT, and CLOSE signals based on custom indicator outputs.
💡 How to Use:
→ Select the custom source for your signals.
→ Define the output values that correspond to each signal type (e.g., “1” for 'LONG', “-1” for SHORT, and “0” for CLOSE).
→ The script will trigger signals according to these custom-defined values.
█ TP/SL SETTINGS
The TP/SL (Take Profit/Stop Loss) Settings feature is designed to give users control over their profit securing and risk mitigation strategies. This feature allows for setting custom TP and SL levels, which can be critical in managing trades effectively.
Features:
Custom TP/SL Levels for Long/Short Signals:
🎯 Purpose:
→ Enables users to set specific percentage levels for Take Profit and Stop Loss on long and short signals.
💡 How to Use:
→ In the TP/SL Settings, input the desired percentage for Take Profit (TP) and Stop Loss (SL).
→ For example, to secure a profit at a 10% price increase on LONG signals, set the “Long TP Percentage” to “10”.
█ STRATEGY SETTINGS
Strategy Settings provide a range of options to customize the trading strategy. These settings include leverage, position direction changes, and more, allowing users to tailor their strategy to their risk tolerance and market view.
Features:
⚙️ Enable Reverse Position:
🎯 Purpose:
→ Automatically closes a current position and opens a new one in the opposite direction upon detecting a signal for a market trend change.
🎯 Example:
→ If a LONG signal is received while in a SHORT position, the script will close the SHORT position and open a LONG position.
💡 How to Use:
→ Activate this feature in the Strategy Settings.
⚙️ Enable Spot Mode:
🎯 Purpose:
→ Disables short orders, using short signals only for closing long positions.
💡 How to Use:
→ Select the 'Spot Mode' option in the Strategy Settings.
⚙️ Enable Invert Signals:
🎯 Purpose:
→ Inverts all indicator signals, changing LONG signals to SHORT and vice versa.
💡 How to Use:
→ Opt for the 'Invert Signals' feature in the Strategy Settings.
⚙️ Enable Trailing Stop:
🎯 Purpose:
→ Triggers a trailing stop order on the exchange instead of a standard stop market order.
☢️ Caution:
→ The backtesting of this feature on TradingView may not accurately reflect actual strategy performance due to discrepancies between TradingView and exchange mechanisms.
💡 How to Use:
→ Select 'Trailing Stop' in the Strategy Settings.
⚙️ Enable Realistic TP & SL:
🎯 Purpose:
→ Goal is protect the user from unrealistic stop loss and take profit prices in live exchange trading conditions.
→ That feature continuously checks the take profit, stop loss and move stop loss prices to prevent unrealistic values. It changes their values according to (minimum realistic percent %)
💡 How to Use:
→ Select 'Enable Realistic TP & SL' in the Strategy Settings. Write min allowed percents.
█ LIMITER SETTINGS
Limiter Settings provide a range of options to customize the trading strategy. These settings include drawdown limits,contract limit, tradable ratio, for allowing users to tailor their strategy to their risk tolerance and market view.
⚙️ Leverage :
🎯 Purpose:
→ Allows users to apply leverage to their trades.
☢️ Caution:
→ High leverage can significantly increase the risk of liquidation.
→ High leverage and a high stop-loss price may override your fixed stoploss percentage, adjusting the stop-loss to the liquidation price.
💡 How to Use:
→ Set the desired leverage ratio in the Strategy Settings.
⚙️ Drawdown Limit:
🎯 Purpose:
→ Sets a maximum drawdown limit, automatically halting the strategy if this limit is reached, thereby controlling risk.
💡 How to Use:
→ Input the maximum drawdown limit (default: 100, min: 0, max: 100).
⚙️ Contract Limit:
🎯 Purpose:
→ Sets a maximum contract limit, beyond which the compound effect cannot be used. This is important to prevent market manipulation through large-volume orders.
💡 How to Use:
→ Input the maximum contract limit (min: 0).
⚙️ Tradable Ratio:
🎯 Purpose:
→ Sets a tradable ratio, it uses that ratio calculating entry cost for position. Main purpose is cash-out and cash-in according to balance change.
💡 How to Use:
→ Input the tradable ratio percent (default: 98, min: 0.1, max: 100).
█ CASH-OUT SETTINGS
Cash-Out Settings offer a money-saving mechanism that prevents entering positions with the entire balance due to cashed-out funds. It functions with a webhook alerts, but the 'Override Allocation %' option must be enabled.
⚙️ Cash-out Threshold %:
🎯 Purpose:
→ It is cash-out mechanism, it saves money with a target threshold.
💡 How to Use:
→ Input the threshold (min: 0).
⚙️ Cash-out Per Profitable Trades %:
🎯 Purpose:
→ It is cash-out mechanism, it saves money from every trade with a percent like commission.
💡 How to Use:
→ Input save percent% (min: 0).
█ ADAPTIVE VOLATILITY STRATEGY SETTINGS
Advanced Strategy Settings offer sophisticated methods for managing Stop Loss (SL) and Take Profit (TP) using the Average True Range (ATR). These settings are ideal for traders who want to incorporate volatility into their exit strategies.
Features:
⚙️ Enable ATR Stop Loss:
🎯 Purpose:
→ Automatically sets the Stop Loss price using the Average True Range at the time of entry.
💡 How to Use:
→ Activate 'ATR Stop Loss' to have the SL price calculated based on the current ATR.
⛓ Enable ATR Trailing Stop:
→ Dynamically updates the Stop Loss price with each new bar, according to the Average True Range.
→ Activate 'ATR Trailing Stop'.
→ Set the ATR Period to define the number of bars for ATR calculation.
→ Adjust the ATR SL Multiplier to determine the stop loss distance.
→ Modify the ATR TP Multiplier for setting the take profit distance.
⚙️ Enable ATR Take Profit:
🎯 Purpose:
→ Sets the Take Profit price based on the Average True Range at the time of entry.
💡 How to Use:
→ Choose 'ATR Take Profit' for TP price determination using ATR.
⚙️ Enable ATR Limit Entry:
🎯 Purpose:
→ Trade can not open in candle close price. Price should hit target price that based on average true range value.
💡 How to Use:
→ Choose 'ATR Limit Entry' for entry price determination using ATR.
⛓ Enable ATR Limit Entry Trailing Price:
→ Dynamically updates the entry price with each new bar, according to the Average True Range.
→ Activate 'ATR Limit Entry Trailing Price'.
→ Set the ATR Period to define the number of bars for ATR calculation.
→ Adjust the ATR SL Multiplier to determine the stop loss distance.
→ Modify the ATR TP Multiplier for setting the take profit distance.
█ TREND FILTERING SETTINGS
Trend Filtering Settings are designed to align trading strategies with the prevailing market trend, enhancing the precision of trade entries and exits. These settings utilize moving averages for trend analysis and decision-making.
Features:
⚙️ Enable Moving Average Filtering:
🎯 Purpose:
→ Limits trades based on moving average trends, blocking short trades in an uptrend and vice versa.
💡 How to Use:
→ Enable 'Trend Filtering'.
→ Set Fast and Slow MA Lengths for trend analysis.
→ Select the Timeframe for moving averages.
→ Choose the Moving Average Type for trend filtering.
🎯 Note:
→ Be cautious with timeframe selections; lower timeframes than the base may cause inconsistencies.
⛓ Exit on Trend Reversal:
→ Automatically closes a position when a market trend reversal is detected.
→ Turn on 'Exit on Trend Reversal' in the settings.
⛓ Ignore Counter Signals:
→ Ignores counter signals during trending market way.
→ If the trend way is long. All short signals will ignore and vice versa.
⛓ Enable Drawing On Chart:
→ Visually represents the trend filter directly on the chart for easy reference.
→ Activate 'Drawing On Chart' to see the trend filter overlaid on the trading chart.
⚙️ Enable Adx Filtering:
🎯 Purpose:
→ Limits trades based on adx value, blocking trades if trend strength is not enough or vice versa for invert mode.
💡 How to Use:
→ Enable 'Adx Filtering'.
→ Set Smoothing and Lengths for adx trend analysis.
→ Select level barrier for trend strength.
⚙️ Enable Custom Filtering:
🎯 Purpose:
→ Limits trades based on custom sources, blocking trades according to custom trades.
💡 How to Use:
→ Enable 'Custom Filtering'.
→ Select fast source.
→ Select slow source.
→ Enable lag mode.
█ MEAN REVERSION FILTERING SETTINGS
Mean Reversion Filtering Settings are designed to align trading strategies during accumulation market conditions. They set a distance from a line to permit trading. The purpose is to ensure that when the price strays too far from the mean line, it should revert back. In accumulation markets, price movements are generally horizontal. In such situations, mean reversion will operate like a grid, enabling profitable trades with low drawdown. However, when the market structure begins to trend, mean reversion filters may not be as profitable as in accumulation markets. For instance, let's say the price is rising and we are shorting the market until it reaches the mean price line. As the price goes up and the mean also rises, we will end up closing the position at a higher price, rendering the mean reversion system non-profitable. Therefore, consider this filter wisely; greater distances might work better in trending markets.
Features:
⚙️ Enable Kairi Filter:
🎯 Purpose:
→ Blocks trades based on distance percent between price and moving average.
💡 How to Use:
→ Enable 'Kairi Filter'.
→ Set Length and Distance Percent.
⛓ Enable Trend Drawing On Chart:
→ Visually represents the trend filter directly on the chart for easy reference.
→ Enable 'Drawing On Chart' to see the allowed regions overlaid on the trading chart with arrows.
⚙️ Enable VWAP Filter:
🎯 Purpose:
→ Blocks trades based on distance percent between price and volume weighted average price.
💡 How to Use:
→ Enable 'VWAP Filter'.
→ Set Timeframe as minutes and distance as percent.
⛓ Exit on Crossing with VWAP:
→ Automatically closes a position when the closing price of a candle crosses the VWAP.
→ Choose "Enable", 'Exit on Crossing with VWAP' in the settings.
⛓ Enable Drawing On Chart:
→ Visually represents the trend filter directly on the chart for easy reference.
→ Enable 'Drawing On Chart' to see the allowed regions overlaid on the trading chart with arrows.
█ LIQUIDATION FILTER SETTINGS
Liquidation filter compares the volume data of futures and spot markets.
Large differences in volume indicate unexpected market conditions, such as massive trading activities, which may signal liquidations.
Features:
⚙️ Enable Liquidation Filter:
🎯 Purpose:
→ Blocks trades based on extra ordinary volume differences in spot and futures market.
💡 How to Use:
→ Enable 'Liquidation Filter'.
→ Set behavior to react during that market conditions.
→ Set base amount to filter volume. This amount changes according to timeframe, you should find right amounts.
→ Liquidation candle count means, it is sum of liquidated candle count in last 20 bars.If you set 0, it means feature is disabled.
→ Detection, try to select the spot and perpetual symbols automatically, symbol names varies, it do not support all symbols, you should choose manually in that situation.
█ AUTOMATED ALERT SETTINGS
Automated Alert Settings are designed to integrate your TradingView script with webhook alerts. These settings allow for enhanced strategy execution and management.
Features:
Enable Webhook Alerts:
🎯 Purpose:
→ Trigger BUY, SELL, CHANGE_DIRECTION or MOVE_STOP_LOSS .
💡 How to Use:
→ Enable 'Webhook Alerts' in the settings.
→ Enter your Strategy Key.
→ Optionally, activate 'Override Allocation Percentage' to bypass the preset allocation percentage.
☢️ Caution:
→ Overriding the allocation percentage may result in trade entry errors due to misalignment between entry cost and available balance.
Enable Custom Alerts:
🎯 Purpose:
→ User can produce unique messages for different purposes.
💡 How to Use:
→ Enable 'Custom Alerts' in the settings.
→ Enter your message format type.
█ DEBUGGING SETTINGS
Debugging Settings are crucial for users who want to analyze and optimize their strategies. These settings provide tools for visualizing alerts on charts and accessing detailed data outputs.
Features:
⚙️ Enable Alert Plotting:
🎯 Purpose:
→ Allows users to visualize trading alerts directly on the chart, aiding in strategy analysis and refinement.
💡 How to Use:
→ Activate 'Alert Plotting' to draw alerts on the chart.
☢️ Caution:
→ It is recommended to disable this feature when creating actual trading alerts, as it can cause latency in signal processing.
⚙️ Enable Debugger Mode:
🎯 Purpose:
→ Facilitates strategy debugging by providing detailed data output in the TradingView Data Window.
💡 How to Use:
→ Turn on 'Debugger Mode' to access real-time data and metrics relevant to your strategy.
⚙️ Enable Table:
🎯 Purpose:
→ Facilitates strategy debugging by providing detailed data output in the TradingView Table on chart.
💡 How to Use:
→ Turn on 'Table' to access last closed candle data and metrics relevant to your strategy.
█ ADDITIONAL SETTINGS
⚙️ Enable Bar Magnifier
⚙️ Enable Using standard OHLC

FreedX Backtest█ Our strategy template empowers TradingView users to effortlessly backtest any indicator, enhancing their trading strategy's effectiveness. In addition, users can create automated webhook alerts from the template. This document details our template's features and how to utilize them effectively.
█ TRADE DATE SETTINGS
The Trading Date Settings feature in our TradingView script allows you to refine their backtesting parameters by specifying trading dates and hours. This feature enhances the accuracy of the backtest by aligning it with specific time frames and days, ensuring that the strategy is tested under relevant market conditions.
Features:
⚙️ Enable Trading Between Specific Dates:
🎯 Purpose:
→ Allows you to limit the backtesting of their strategy to a specific date range.
💡 How to Use:
→ Input the Start Date and End Date for the backtest period.
→ The script will execute the strategy only within this specified date range.
⚙️ Enable Trading Between Specific Hours:
🎯 Purpose:
→ Allows you to limit the backtesting of their strategy to a specific hour range.
💡 How to Use:
→ Input the start and end hour for in Trading Session section.
→ The script will execute the strategy only within this specified hour range.
⚙️ Enable Trading on Specified Days of the Week:
🎯 Purpose:
→ Gives you the option to conduct backtesting on selected days of the week, tailoring the strategy to particular market behaviours that may occur on these days.
💡 How to Use:
→ Select the days of the week for the backtest.
→ The script will activate the trading strategy only on these chosen days.
█ BUY/SELL TRIGGER SETTINGS
The Buy/Sell Trigger Settings feature is designed to provide users with flexibility in defining the conditions for 'LONG' and 'SHORT' signals based on various indicator types. This customization is crucial for tailoring strategies to different trading styles and market conditions.
Features:
⚙️ Single-Line Plotted Indicators :
🎯 Purpose:
→ Enables you to select a single-line plotted indicator as a source for backtesting. You can define specific levels to trigger 'LONG' or 'SHORT' signals.
💡 How to Use:
→ Choose a Single-Line Plotted indicator as the source.
→ Set the top and bottom levels for the indicator.
→ The script triggers 'LONG' signals at the bottom level and 'SHORT' signals at the top level.
⚙️ Two-Line Plotted Indicators :
🎯 Purpose:
→ Allows backtesting with two-line cross plot sources. Signals are generated based on the crossover of these lines.
💡 How to Use:
→ Select two lines as 'Source 1' and 'Source 2' for the indicator.
→ The script triggers a 'LONG' signal when 'Source 1' crosses above 'Source 2'.
→ Conversely, a 'SHORT' signal is triggered when 'Source 2' crosses above 'Source 1'.
⚙️ Custom Signals :
🎯 Purpose:
→ This setting enables users to define their own criteria for LONG, SHORT, and CLOSE signals based on custom indicator outputs.
💡 How to Use:
→ Select the custom source for your signals.
→ Define the output values that correspond to each signal type (e.g., “1” for 'LONG', “-1” for SHORT, and “0” for CLOSE).
→ The script will trigger signals according to these custom-defined values.
█ TP/SL SETTINGS
The TP/SL (Take Profit/Stop Loss) Settings feature is designed to give users control over their profit securing and risk mitigation strategies. This feature allows for setting custom TP and SL levels, which can be critical in managing trades effectively.
Features:
Custom TP/SL Levels for Long/Short Signals:
🎯 Purpose:
→ Enables users to set specific percentage levels for Take Profit and Stop Loss on long and short signals.
💡 How to Use:
→ In the TP/SL Settings, input the desired percentage for Take Profit (TP) and Stop Loss (SL).
→ For example, to secure a profit at a 10% price increase on LONG signals, set the “Long TP Percentage” to “10”.
█ STRATEGY SETTINGS
Strategy Settings provide a range of options to customize the trading strategy. These settings include leverage, drawdown limits, position direction changes, and more, allowing users to tailor their strategy to their risk tolerance and market view.
Features:
⚙️ Enable Leverage :
🎯 Purpose:
→ Allows users to apply leverage to their trades.
☢️ Caution:
→ High leverage can significantly increase the risk of liquidation.
→ High leverage and a high stop-loss price may override your fixed stoploss percentage, adjusting the stop-loss to the liquidation price.
💡 How to Use:
→ Set the desired leverage ratio in the Strategy Settings.
⚙️ Enable Drawdown Limit:
🎯 Purpose:
→ Sets a maximum drawdown limit, automatically halting the strategy if this limit is reached, thereby controlling risk.
💡 How to Use:
→ Input the maximum drawdown limit (default: 100, min: 0, max: 100).
⚙️ Enable Reverse Position:
🎯 Purpose:
→ Automatically closes a current position and opens a new one in the opposite direction upon detecting a signal for a market trend change.
🎯 Example:
→ If a LONG signal is received while in a SHORT position, the script will close the SHORT position and open a LONG position.
💡 How to Use:
→ Activate this feature in the Strategy Settings.
⚙️ Enable Spot Mode:
🎯 Purpose:
→ Disables short orders, using short signals only for closing long positions.
💡 How to Use:
→ Select the 'Spot Mode' option in the Strategy Settings.
⚙️ Enable Invert Signals:
🎯 Purpose:
→ Inverts all indicator signals, changing LONG signals to SHORT and vice versa.
💡 How to Use:
→ Opt for the 'Invert Signals' feature in the Strategy Settings.
⚙️ Enable Trailing Stop:
🎯 Purpose:
→ Triggers a trailing stop order on the exchange instead of a standard stop market order.
☢️ Caution:
→ The backtesting of this feature on TradingView may not accurately reflect actual strategy performance due to discrepancies between TradingView and exchange mechanisms.
💡 How to Use:
→ Select 'Trailing Stop' in the Strategy Settings.
█ ADVANCED STRATEGY SETTINGS
Advanced Strategy Settings offer sophisticated methods for managing Stop Loss (SL) and Take Profit (TP) using the Average True Range (ATR). These settings are ideal for traders who want to incorporate volatility into their exit strategies.
Features:
⚙️ Enable ATR Stop Loss:
🎯 Purpose:
→ Automatically sets the Stop Loss price using the Average True Range at the time of entry.
💡 How to Use:
→ Activate 'ATR Stop Loss' to have the SL price calculated based on the current ATR.
⚙️ Enable ATR Take Profit:
🎯 Purpose:
→ Sets the Take Profit price based on the Average True Range at the time of entry.
💡 How to Use:
→ Choose 'ATR Take Profit' for TP price determination using ATR.
⚙️ Enable ATR Trailing Stop:
🎯 Purpose:
→ Dynamically updates the Stop Loss price with each new bar, according to the Average True Range.
💡 How to Use:
→ Activate 'ATR Trailing Stop'.
→ Set the ATR Period to define the number of bars for ATR calculation.
→ Adjust the ATR SL Multiplier to determine the stop loss distance.
→ Modify the ATR TP Multiplier for setting the take profit distance.
█ TREND FILTERING SETTINGS
Trend Filtering Settings are designed to align trading strategies with the prevailing market trend, enhancing the precision of trade entries and exits. These settings utilize moving averages for trend analysis and decision-making.
Features:
⚙️ Enable Trend Filtering:
🎯 Purpose:
→ Limits trades based on moving average trends, blocking short trades in an uptrend and vice versa.
💡 How to Use:
→ Enable 'Trend Filtering'.
→ Set Fast and Slow MA Lengths for trend analysis.
→ Select the Timeframe for moving averages.
→ Choose the Moving Average Type for trend filtering.
🎯 Note:
→ Be cautious with timeframe selections; lower timeframes than the base may cause inconsistencies.
⚙️ Enable Exit on Trend Reversal:
🎯 Purpose:
→ Automatically closes a position when a market trend reversal is detected.
💡 How to Use:
→ Turn on 'Exit on Trend Reversal' in the settings.
⚙️ Enable Trend Drawing On Chart:
🎯 Purpose:
→ Visually represents the trend filter directly on the chart for easy reference.
💡 How to Use:
→ Activate 'Trend Drawing On Chart' to see the trend filter overlaid on the trading chart.
█ AUTOMATED ALERT SETTINGS
Automated Alert Settings are designed to integrate your TradingView script with webhook alerts. These settings allow for enhanced strategy execution and management.
Features:
Enable Webhook Alerts:
🎯 Purpose:
→ Trigger BUY, SELL, CHANGE_DIRECTION or MOVE_STOP_LOSS .
💡 How to Use:
→ Enable 'Webhook Alerts' in the settings.
→ Enter your Strategy ID.
→ Optionally, activate 'Override Allocation Percentage' to bypass the preset allocation percentage.
☢️ Caution:
→ Overriding the allocation percentage may result in trade entry errors due to misalignment between entry cost and available balance.
█ DEBUGGING SETTINGS
Debugging Settings are crucial for users who want to analyze and optimize their strategies. These settings provide tools for visualizing alerts on charts and accessing detailed data outputs.
Features:
⚙️ Enable Alert Plotting:
🎯 Purpose:
→ Allows users to visualize trading alerts directly on the chart, aiding in strategy analysis and refinement.
💡 How to Use:
→ Activate 'Alert Plotting' to draw alerts on the chart.
☢️ Caution:
→ It is recommended to disable this feature when creating actual trading alerts, as it can cause latency in signal processing.
⚙️ Enable Debugger Mode:
🎯 Purpose:
→ Facilitates strategy debugging by providing detailed data output in the TradingView Data Window.
💡 How to Use:
→ Turn on 'Debugger Mode' to access real-time data and metrics relevant to your strategy.
█ ADDITIONAL SETTINGS
⚙️ Enable Bar Magnifier
⚙️ Enable Using standard OHLC

The Master Pattern Indicator***READ THIS FIRST****
THE MASTER PATTERN Indicator
USER AGREEMENT
*** The personal/private use of this indicator is allowed, commercial use is FORBIDDEN.
***Commercial use will be interpreted as taking advantage of the free indicator in order to profit from it, for example: as part of any courses or mentorships offering training of the indicator or the concept its based. You don't need to pay for any training for this, the strategy is a simple trend following approach, even a caveman would understand.
**********************************************************************************************************************
Now please enjoy the BEST Master Pattern indicator you will ever find for Tradingvew, and for the best price: FREE.
Please do not give money to people trying to charge you for any inferior version of this indicator.
DESCRIPTION
The Master Pattern indicator or The Forex Master Pattern is an alternative form of technical analysis that provides a framework which will help you to find and follow the hidden price pattern that reveals the true intentions of financial markets. This algorithm I came up with does a very good job detecting the Phase 1 of the Forex Master Pattern cycle, which is the contraction point (or Value), and then proceeds to differentiate between major or minor lines and prints the liquidity lines the correct manner in relation to the swings expanding from the contraction.
On Phase 2 we get higher timeframe activation (also called Expansion), which is where price oscillates above and below the average price defined on Phase 1.
On Phase 3 is where we get a sustained deviation from value (the Trend).
In a very short time you will start noticing this pattern, even on naked charts. It is all a matter of training your eyes - the more time you invest studying the charts with this indicator (both historically and replaying the market on strategy tester), the faster you will become familiar with this method.
This indicator DOES NOT REPAINT. You can safely study the chart historically because what is printed historically is what prints real time.
Why do traditional based indicator systems fail over time? Because the markets move in cycles that constantly change structure. Those traditional indicator systems must be constantly optimized and settings tinkered with because of the changing market environment. There are an infinite number of variables that affect price so no exact technical system can work the same forever, which is also the reason why most bots/EA fail.
If you learn to spot the Forex Master Pattern and understand the sequence of the real cycles that drive the markets, you can more accurately forecast market behavior. By using traditional indicators you end up masking this pattern.
Use the insights provided by the Forex Master Pattern indicator to elevate your trading to the next level.
This method of analysis works in any liquid market and timeframe.
VERY IMPORTANT:
The default setting of historical bars is set to 500. This is more than enough for day trading and ensures fast drawings loading time and stable performance. Bear in mind that, the more bars you choose to load historically, the longer it will take to draw everything. The max setting of this input for now is 800. If it is possible to increase it, I will update the code. So if you want to make historical analysis far in the past, just use the chart replay feature.
Indicator Parameters:
They are all self-explanatory, except Type. You can choose between 1 and 2.
1 is better suited for LTF (M1 to M30)
2 is better suited for HTF (H1 and upwards)
However, this is my personal preference. You can of course experiment and choose what looks best for you.
Instructions to use the alert function:
1st step - Choose symbol and timeframe for the alert
2nd step - Go to indicator settings and tick/untick the boxes for the alerts you want
3rd step - Click on the ... (three dots) next to the indicator name (chart upper left corner) and click to add indicator alert
Then it's gonna add the alert with the conditions that you've ticked/unticked inside indicator settings.
Then repeat the process for different symbols, timeframes and different alert conditions.

Multi Bollinger Bands with Over ZoneThis indicator is called "Multi Bollinger Bands with Over Zone". The indicator uses linear regression to calculate the regression line and standard deviation to calculate the upper and lower deviation lines. It also plots filled areas between the deviation lines to highlight overbought and oversold zones.
The indicator has several customizable inputs, including the length of the regression period, depth, and deviations used to calculate the deviation lines.
The regression line is plotted in green color with circle markers. The upper and lower deviation lines are plotted in blue and red colors, respectively. The area between the deviation lines is filled with light blue color for the overbought zone and light pink color for the oversold zone.
This indicator helps traders in identifying trends and potential price reversals. When the price is above the upper deviation line, it indicates a potential overbought zone, while when the price is below the lower deviation line, it indicates a potential oversold zone.
Please note that this indicator is only a tool for analysis and does not provide direct trading signals. It is important to combine this indicator with additional analysis and appropriate trading strategies.

Option ScalperWhat is Scalping?
Scalping is a trading strategy aimed at profiting from quick momentum in a volatile index or stock or any other instrument that can be traded.
Traders who use such strategies place anywhere from 10 to a few hundred trades in a single day.
The idea behind such type of trading is that small moves in an index or stock price are much easier to capture than the larger moves.
Traders who use such strategies are known as scalpers. When you take many small profits a number of times, say 10 points scalped 20 times per day, they can easily add up to large gains.
An Option Buyer's Biggest Enemy is Time Decay and when you scalp, you do not allow the time decay to eat your Option Premium as your Entry and Exit is often quick enough.
What is Option Scalper?
Option Scalper indicator is a momentum-based indicator that tries to detect momentum based upon a number of factors as given below:
(1) Price action accumulated over a period of time when big candles are nowhere
(2) Repeatedly Occurring, certain Candle patterns which indicate if buyers have the upper hand or sellers are ruling the market.
(3) Gradient of moving averages which shows consistency of net buying/selling force
(4) Price jumping normal distribution line and landing in outlying areas, signalling increasing momentum of buying/selling activity.
Based upon the above factors, when Option Scalper thinks a move has the potential to turn into a big move, it generates its Buy/Sell Signals.
When aggressive buying or selling starts where Buying & Selling Forces become unequal, the Price starts moving in one direction with candles making Higher Highs or Lower Lows, moving average lines start scaling up or down or volumes start increasing.
Option Scalper detects these (1) Higher Highs or Lower Lows, (2) scaling up moving average lines, and/or (3) price breaking out of channels; and generates Buy or Sell signals.
In order to use this indicator, simply deploy this on your chart, and wait for Buy/Sell signals. When a Buy/Sell Signal appears, a small line starts forming up at the closing level of Buy/Sell signal candle. Your Entry will be above that line for Buy Signal and below that line for Sell Signal.
It works on all time frames.
Whenever a Buy Signal is followed by Sell signal (let it be after 7 - 8 candles or after many candles) or vice-versa, you have to switch your position to make most of the reverse move.
It is a general purpose indicator and may be used on stocks, commodities, forex and any other instruments alike and is not meant for any specific market.
How to Take Buy/Sell Entry with Option Scalper?
Whenever a Buy/Sell Signal appears on a candle, Option Scalper starts marking its closing price with a horizontal line that keeps extending towards right side with every new candle. This line is Blue in Color for Buy Signal and dark golden color for Sell Signal.
Initially this horizontal line will be very small but as more and more candles appear with the passage of time, the length of the line keeps increasing.
The purpose of this line is to mark the closing price of Signal candle and you have to take your Buy Entry above this line (if last signal is BUY) or you have to take your trade Below this line (if last signal is SELL).
The indicator will also draw another line at the Opening Price of Signal Candle, which can act as your initial stop loss. If trade starts moving in your direction and price goes above upper variance line (light green curvy line) or goes below lower variance line (purple wavy line), then that line becomes your trailing stop loss line from that point onwards.
The indicator also marks the consolidation zone for you. If the Buy/Sell Signal has come but price is in consolidation zone (grey colour cloud), do not take any positions yet and wait for the price to come out of the cloud and breach the Entry Line.
Exiting Buy/Sell Positions and Re-Entry Rules
1. Exiting your Buy Trade: When a Buy Trade is active, indicator can detect where the ongoing upmove may end or retrace for a while and it will print an X symbol (RED COLOR) to warn you. After you see a Red Color X symbol, if price starts making lower lows, you can exit your Buy Trade there or if you are in good profit, you can wait for the price to go below upper variance line (the green color Trailing Stop Loss Line for Buy Trade). See the image below for Red Color X symbol which warns you to be prepared for EXIT from Buy Trade:
2. Re-Entry for Buy Trade: If the last signal on your chart is still Buy Signal but your stop loss has been hit once or twice and you have no open positions now, you can RE-ENTER in buy trade if and when price again climbs above the grey cloud.
3. Exiting your Sell Trade: When a Sell Trade is active, indicator can detect where the ongoing down-move may end or retrace for a while and it will print an X symbol (Green COLOR) to warn you. After you see a Green Color X symbol, if price starts making higher highs, you can exit your Sell Trade there or if you are in good profit, you can wait for the price to go above lower variance line (the purple color Trailing Stop Loss Line for Sell Trade).
4. Re-Entry for Sell Trade: If the last signal on your chart is Sell Signal but your stop loss has been hit once or twice and you have no open positions now, you can RE-ENTER in Sell trade if and when price again crosses below the grey color cloud.
See the image below for recognizing Red and Green X symbols which indicate that temporary retracement or reversal signal is developing:
What are the other features of Option Scalper?
1. End to End Horizontal Support/Resistance Lines: Indicator also detects, prints and deletes horizontal support and resistance lines which can help in your trading decisions. For example, a Buy Signal comes and price crosses above upper variance line and also crosses nearby horizontal resistance line means it has higher probability of moving further up. The reverse is also true (for Sell Signal). See an example of a resistance line below:
2. Star Symbols: If 5 or more consecutive candles are of the same color, then Star Symbol (*) starts appearing above or below the candles. When price has moved too high or too low from the upper or lower variance line, these stars indicate that there is higher probability of retracement happening now which should prompt you to book full or partial profit. See the circled stars in the below image
3. Color Changing Candles: If a candle changes its color from Red to Purple or from Green to light green, they indicate increased intensity of Selling or Buying activity. For example, if each 1 min candle within a 5 min candle is red, then that 5 min candle will turn purple which means Selling pressure is too much and there are very few or no buyers at all. Reverse is also true when Green Candle becomes Light Green. Example images of such candles can be seen below:
4. Consolidation Zone: It is very important for an option buyer to strike only when there is momentum and not to take any fresh trade (or if you already have a position, then closing it for the time being) when price is in consolidation zone. Consolidation zone is marked by a grey colour cloud as seen in below image.
What Type of Alerts Can be Set up: You can set up 3 type of alerts with this indicator (a) Buy Entry Signal which happens when Price closes above the marked Buy Price Level (b) Sell Signal which happens when Price closes below the marked Sell Price Level or (c) Any signal (if you want to be alerted when either Buy or Sell Signal happens)
How to get this indicator?
This is invite-only indicator. Get in touch with us using information given below in Signature field to try this indicator FREE. You may also chat with us through Private Chat feature of TradingView.

Strongest Supports And ResistancesDraws the best support and resistance lines. How it works:
1) Tries every possible line through lows, highs, opens, closes
2) Finds the total hit counts given the confidence interval as input to the candlesticks
3) Calculates the strength of every line according to hit count, total volumes on hits, and timestamps
4) Eliminates similar lines, confidence interval is set as input
5) Selects the strongest 20(changable as an input) lines and draws them on the graph.
Makes your work way easier!!!
Feel free to adjust the parameters for your own style!
Cheers!!

HARKAT momentombest indicator for momentom and movement
in btcusdt 15 min just harkat above 1 indicates movment in market
in bearish or bullish trend

Bjorgum Double Tap█ OVERVIEW
Double Tap is a pattern recognition script aimed at detecting Double Tops and Double Bottoms. Double Tap can be applied to the broker emulator to observe historical results, run as a trading bot for live trade alerts in real time with entry signals, take profit, and stop orders, or to simply detect patterns.
█ CONCEPTS
How Is A Pattern Defined?
Doubles are technical formations that are both reversal patterns and breakout patterns. These formations typically have a distinctive “M” or a “W” shape with price action breaking beyond the neckline formed by the center of the pattern. They can be recognized when a pivot fails to break when tested for a second time and the retracement that follows breaks beyond the key level opposite. This can trap entrants that were playing in the direction of the prior trend. Entries are made on the breakout with a target projected beyond the neckline equal to the height of the pattern.
Pattern Recognition
Patterns are recognized through the use of zig-zag; a method of filtering price action by connecting swing highs and lows in an alternating fashion to establish trend, support and resistance, or derive shapes from price action. The script looks for the highest or lowest point in a given number of bars and updates a list with the values as they form. If the levels are exceeded, the values are updated. If the direction changes and a new significant point is made, a new point is added to the list and the process starts again. Meanwhile, we scan the list of values looking for the distinctive shape to form as previously described.
█ STRATEGY RESULTS
Back Testing
Historical back testing is the most common method to test a strategy due in part to the general ease of gathering quick results. The underlying theory is that any strategy that worked well in the past is likely to work well in the future, and conversely, any strategy that performed poorly in the past is likely to perform poorly in the future. It is easy to poke holes in this theory, however, as for one to accept it as gospel, one would have to assume that future results will match what has come to pass. The randomness of markets may see to it otherwise, so it is important to scrutinize results. Some commonly used methods are to compare to other markets or benchmarks, perform statistical analysis on the results over many iterations and on differing datasets, walk-forward testing, out-of-sample analysis, or a variety of other techniques. There are many ways to interpret the results, so it is important to do research and gain knowledge in the field prior to taking meaningful conclusions from them.
👉 In short, it would be naive to place trust in one good backtest and expect positive results to continue. For this reason, results have been omitted from this publication.
Repainting
Repainting is simply the difference in behaviour of a strategy in real time vs the results calculated on the historical dataset. The strategy, by default, will wait for confirmed signals and is thus designed to not repaint. Waiting for bar close for entires aligns results in the real time data feed to those calculated on historical bars, which contain far less data. By doing this we align the behaviour of the strategy on the 2 data types, which brings significance to the calculated results. To override this behaviour and introduce repainting one can select "Recalculate on every tick" from the properties tab. It is important to note that by doing this alerts may not align with results seen in the strategy tester when the chart is reloaded, and thus to do so is to forgo backtesting and restricts a strategy to forward testing only.
👉 It is possible to use this script as an indicator as opposed to a full strategy by disabling "Use Strategy" in the "Inputs" tab. Basic alerts for detection will be sent when patterns are detected as opposed to complex order syntax. For alerts mid-bar enable "Recalculate on every tick" , and for confirmed signals ensure it is disabled.
█ EXIT ORDERS
Limit and Stop Orders
By default, the strategy will place a stop loss at the invalidation point of the pattern. This point is beyond the pattern high in the case of Double Tops, or beneath the pattern low in the case of Double Bottoms. The target or take profit point is an equal-legs measurement, or 100% of the pattern height in the direction of the pattern bias. Both the stop and the limit level can be adjusted from the user menu as a percentage of the pattern height.
Trailing Stops
Optional from the menu is the implementation of an ATR based trailing stop. The trailing stop is designed to begin when the target projection is reached. From there, the script looks back a user-defined number of bars for the highest or lowest point +/- the ATR value. For tighter stops the user can look back a lesser number of bars, or decrease the ATR multiple. When using either Alertatron or Trading Connector, each change in the trail value will trigger an alert to update the stop order on the exchange to reflect the new trail price. This reduces latency and slippage that can occur when relying on alerts only as real exchange orders fill faster and remain in place in the event of a disruption in communication between your strategy and the exchange, which ensures a higher level of safety.
👉 It is important to note that in the case the trailing stop is enabled, limit orders are excluded from the exit criteria. Rather, the point in time that the limit value is exceeded is the point that the trail begins. As such, this method will exit by stop loss only.
█ ALERTS
Five Built-in 3rd Party Destinations
The following are five options for delivering alerts from Double Tap to live trade execution via third party API solutions or chat bots to share your trades on social media. These destinations can be selected from the input menu and alert syntax will automatically configure in alerts appropriately to manage trades.
Custom JSON
JSON, or JavaScript Object Notation, is a readable format for structuring data. It is used primarily to transmit data between a server and a web application. In regards to this script, this may be a custom intermediary web application designed to catch alerts and interface with an exchange API. The JSON message is a trade map for an application to read equipped with where its been, where its going, targets, stops, quantity; a full diagnostic of the current state and its previous state. A web application could be configured to follow the messages sent in this format and conduct trades in sync with alerts running on the TV server.
Below is an example of a rendered JSON alert:
{
"passphrase": "1234",
"time": "2022-05-01T17:50:05Z",
"ticker": "ETHUSDTPERP",
"plot": {
"stop_price": 2600.15,
"limit_price": 3100.45
},
"strategy": {
"position_size": 0.1,
"order_action": "buy",
"market_position": "long",
"market_position_size": 0,
"prev_market_position": "flat",
"prev_market_position_size": 0
}
}
Trading Connector
Trading Connector is a third party fully autonomous Chrome extension designed to catch alert webhooks from TradingView and interface with MT4/MT5 to execute live trades from your machine. Alerts to Trading Connector are simple; just select the destination from the input drop down menu, set your ticker in the "TC Ticker" box in the "Alert Strings" section and enter your URL in the alert window when configuring your alert.
Alertatron
Alertatron is an automated algo platform for cryptocurrency trading that is designed to automate your trading strategies. Although the platform is currently restricted to crypto, it offers a versatile interface with high flexibility syntax for complex market orders and conditions. To direct alerts to Alertatron, select the platform from the 3rd party drop down, configure your API key in the ”Alertatron Key” box and add your URL in the alert message box when making alerts.
3 Commas
3 Commas is an easy and quick to use click-and-go third party crypto API solution. Alerts are simple without overly complex syntax. Messages are simply pasted into alerts and executed as alerts are triggered. There are 4 boxes at the bottom of the "Inputs" tab where the appropriate messages to be placed. These messages can be copied from 3 Commas after the bots are set up and pasted directly into the settings menu. Remember to select 3 Commas as a destination from the third party drop down and place the appropriate URL in the alert message window.
Discord
Some may wish to share their trades with their friends in a Discord chat via webhook chat bot. Messages are configured to notify of the pattern type with targets and stop values. A bot can be configured through the integration menu in a Discord chat to which you have appropriate access. Select Discord from the 3rd party drop down menu and place your chat bot URL in the alert message window when configuring alerts.
👉 For further information regarding alert setup, refer to the platform specific instructions given by the chosen third party provider.
█ IMPORTANT NOTES
Setting Alerts
For alert messages to be properly delivered on order fills it is necessary to place the following placeholder in the alert message box when creating an alert.
{{strategy.order.alert_message}}
This placeholder will auto-populate the alert message with the appropriate syntax that is designated for the 3rd party selected in the user menu.
Order Sizing and Commissions
The values that are sent in alert messages are populated from live metrics calculated by the strategy. This means that the actual values in the "Properties" tab are used and must be set by the user. The initial capital, order size, commission, etc. are all used in the calculations, so it is important to set these prior to executing live trades. Be sure to set the commission to the values used by the exchange as well.
👉 It is important to understand that the calculations on the account size take place from the beginning of the price history of the strategy. This means that if historical results have inflated or depleted the account size from the beginning of trade history until now, the values sent in alerts will reflect the calculated size based on the inputs in the "Properties" tab. To start fresh, the user must set the date in the "Inputs" tab to the current date as to remove trades from the trade history. Failure to follow this instruction can result in an unexpected order size being sent in the alert.
█ FOR PINECODERS
• With the recent introduction of matrices in Pine, the script utilizes a matrix to track pivot points with the bars they occurred on, while tracking if that pivot has been traded against to prevent duplicate detections after a trade is exited.
• Alert messages are populated with placeholders ; capability that previously was only possible in alertcondition() , but has recently been extended to `strategy.*()` functions for use in the `alert_message` argument. This allows delivery of live trade values to populate in strategy alert messages.
• New arguments have been added to strategy.exit() , which allow differentiated messages to be sent based on whether the exit occurred at the stop or the limit. The new arguments used in this script are `alert_profit` and `alert_loss` to send messages to Discord

Best Ichimoku Buy and Sell with alertsThis is Indicator is based on Ichimoku Clouds with Buy and Sell positions and alerts. Before using this indicator take note of the following:
1. This indicator is not Repaiting.
2. there are three ways to put your SL/TP:
* you can use the yellow line above or below the candles to put your SL and your R/R ratio will be 1:1, 1:2, 1:3 (depending on the timeframe and the pairs you choose; I advise you to backtest in your desired timeframe and your currency pairs to choose the right R/R)
* You can choose SL/TP based on Percentage or ATR (It is configurable in the setting; I again advise you to backtest in your desired timeframe and your currency pairs to choose the right R/R)
3. Please pay attention to the Green and Red circles. If there is a Green circle before the Buy position it gives it more confirmation and if there is a Red circle before the Sell position it gives more confirmation on the Sell position (pay attention that these circles appear with latency)
4. If the yellow line is below the candles and it gives Sell signal or the yellow line is above the candles and it gives Buy signal, it is better to avoid that signals.
4. Use this indicator with top 30 Crypto pairs (You can also backtest on other coins as well)
5. Please use this indicator at your discretion and backtest first.
6. If you have any idea to improve the results please let me know in the comments.

[UPRIGHT Trading] OrderZones - Supply & Demand (Predictive) (cc)Hello Traders,
This is one that I've been working on a very, Very long time. As easy as it is to draw after the fact, as someone well versed in Supply and Demand; it's a bit more difficult to create all the calculations to show them, code them out, and then I went a step further — attempting to predict future ones as well.
Let's talk about what Supply & Demand Zones are. They are a pattern and technical analysis technique used in day and swing trading. Demand zone represents the area with strongest buying pressure and Supply zone represents selling pressure. Often these zones will show Institutional/Large buyers and sellers executing their orders causing price to move up or down very quickly, creating a long wick on a small and sometimes momentum that feeds into the larger timeframes. Therefore, in the simplest terms, the Supply and Demand Orderzones are the zones the price often gets rejected from or returned to; when Demand exceeds Supply, price jumps up and vice versa.
Unlike lines of support and resistance , these are zones more closely than precise lines, but can help gauge Support and Resistance on the fly.
Richard Wykoff was one of the first market analysts to explain the interaction of these phases, giving them four labels. It is in the understanding of Wyckoff's explanation of market price action, that supply and demand zones are also known as Accumulation and Distribution zones (Accumulation, Markup, Distribution, Markdown).
Shows potential entries on break from zone. Pivots. Large breakdowns or breakouts signalling possible trend change.
Super Fast Real-time Orderzone creation. Resistance line at Supply, shows multiple dimensions of each zone when large enough.
Different calculation, line, transparency settings
Minimalist mode with autobox
Features:
Multiple calculation modes with different lengths and displays.
AutoBox (Predictive Orderzones).
Buy/Sell Highlights.
UPRIGHT – Ultimate Reversals (Support/Resistance version).
Breakouts/Breakdowns + Signals.
Pivot Labels (HH, HL, etc).
Pivot Bar.
Pivot Buy /Sell Signals.
Fully Customizable—Change line types, transparency, colors, etc).
I am still working on the calculations for one more addition, but as it is, this should help anyone automate their S/D technical analysis.
Please see author instructions for access.
Cheers,
Mike
(UPRIGHT Trading)

[UPRIGHT Trading] Trend Direction Force Index (TDFI)The Trend Direction Force Index, TDFI or TDF Index, is a staple in the Forex community, but is excellent on most asset (i.e. stock) trading.
Developed by Pyotr Wojdyo for metastock trading platform originally, but now on several other.
The idea of the TDFI is that there is enough trend directional force to enter the trade.
How it works:
When the signal is above the high threshold, the trader can go long.
When the signal is below the low threshold, the trader can go short.
It's usually used as confirmation along with another indicator.
Features:
Fully customizable
Built-in color changing
Alerts!
If you like this, you will definitely like what else I've published.
Like, follow, support, etc.
Enjoy.
Cheers,
Mike
(UPRIGHT Trading)

[UPRIGHT Trading] Auto-Trendlines Pro (cc)Hello Traders -
Today I am releasing a full-featured auto-trendline indicator.
This makes it easier for beginners and professionals alike to analyze a charts trending support and resistance.
What are Trendlines and why do we use them?
In short, a trendline is a diagonal line that connects to two or more price points on a chart to show the current direction of price. These are used to identify and confirm trend direction in technical analysis and show support and resistance points.
Utilizing pivot points and different calculations for sources we're able to create the trendlines; with adjustable slopes (or just use of proprietary calculations) we are able to make these lines to line up with the current trend.
How it's different:
Accurate auto-drawn calculated trendlines.
Fully customizable - the ability to adjust the trendlines easily to exact specifications with every type of trader in mind.
Can be used to spot long trend as well as short, by adjusting length or using extend both to see previous pivots it's touched.
Then retracted, for perfect long trend.
Can show old trendlines for analysis (click image to see).
Auto-labels Higher-Highs, Higher-Lows, Lower-Highs, Lower-Lows at pivots.
Lining up trendlines with Break signals can help provide more accurate trendlines (potentially teaching) beginners how to draw them better.
Signature double trendline set.
Also notice the additional sell/buy signals (shown above).
Squeeze / Low-float mode adjusts to fit big moves.
Adjust the opacity to hide or fade a line (as seen above).
Pre-filled alerts for breakouts / breakdowns.
Please see author instructions for access.
Cheers,
Mike
(UPRIGHT Trading)
[UPRIGHT Trading] Awesome STC+Hello Traders,
I hope you all are doing well.
Today I'm releasing another one of my favorites: the Schaff Trend Cycle (STC). In 2008, Doug Schaff publically released the STC as an improvement on cycle oscillators and the MACD, hence its common nickname, "The better MACD."
This oscillator is essentially a fusion of the benefits of trend and cycle indicators; the idea is to minimize their drawbacks, such as lags or false signals. The STC is mainly used to determine or confirm price direction and market reversals.
We calculate the STC as a double smoothed stochastic of the MACD, which outputs an oscillator that moves between 0 and 100.
How is it typically used?
In trending markets, we can expect the oscillator to move up if the market is in the accelerating uptrend and an accelerating downtrend are to push the oscillator down.
In sideways markets, the STC shows oversold when it reverses after falling below 25; overbought when the STC turns down from above 75.
How the Awesome STC+ is different:
This STC uses several complex equations and filters to improve accuracy and reduce lag.
My original STC wave.
Multiple extremely accurate Buy/Sell signals not found on a traditional STC indicator.
Ability to use 4 different background highlights and several buy/sell and confirmation signals.
Fully customizable (as always), ability to turn on or off any signals, change any of the colors to suit your needs.
Pre-filled Alerts.
Reversals and Continuations.
Chart should look like this:
Please see the "Author's Instructions" for access.
Cheers,
Mike
(UPRIGHT Trading)

Precise Supply Demand Levels
Concept of Supply and Demand Zones
The concept of supply and demand zones is confusing to some traders. And most tend to believe it's not a concrete concept to be relied upon as they don't exactly know where to draw the lines precisely that best represents the supply and demand zones.
A demand zone is where most traders placing their buy order based on the historical trade analysis; these areas could be found at the lowest low with strong support levels. A demand zone is formed where price is most deviated from it's equilibrium market price in lower direction where most sellers has exhausted their energy along the way and the buyers has regained their energy for a bullish momentum.
A supply zone is where most traders placing their sell orders. These are are often found at the highest high with strong resistance level. A supply zone is formed where price is most deviated from it's equilibrium market price in higher direction where most buyers has exhausted their energy along the way and the sellers has regained their energy for a bearish momentum.
Underlying Algorithm used in the indicator
I am using the of concept of "Frequency Lines" to calculate the areas. Lines with the highest frequency has the most support and resistant strength to cause a reversal on the opposite direction.
Settings and Stylings
Lookback : Default is 50 (The lookback period for calculatibf pivots)
No of Pivots: Default is 3 (The maximum number of pivots to consider, higher will result more boxes)
Aligned: Default is True
Whether to align the supply demand levels or not. If true, it will check the deviation of adjacent supply demand levels, if they are very close it will align themselves vertically to create a single level of support or resistance.
A layout with the levels not aligned
Aligned layout
This levels also will most of the times work as support and resistance levels.
I haven't added any other extra features to make the performance robust. Although I might add in future upon requests.
For now I am keeping it in protected mode, as this is my first indicator script and I am unsure of what to expect from it, but If I get enough of your support and love, I might make the source code public.
Thank you for visiting my page and I hope this helps in your trading journey. If it does truly help, follow me as I will be publishing many more indicators soon.

[UPRIGHT] Awesome DMI+Hello Traders,
Today I'm releasing a spin on an 'oldie but goodie'; the Directional Movement Index (DMI).
DMI is a combination of 3 different indicators developed by the famous J. Welles Wilder. DMI has 3 different plots: the ADX, +DI, and -DI. The first is the ADX (Average Directional Index), which Wilder created in 1978 to show the strength of a trend by comparing the current price with the previous price range. The other two are the +DI (positive directional indicator) and the -DI show up as two separate lines, +DI is the difference between the highest price of the current day and the highest price of the day before, and -DI does the same calculation with the current and previous day's lows.
How does it work?
When the ADX line is above 25 (as a general rule, some traders use a different threshold, +/- 5), the trend is strong. When the +DI line is above the -DI line, the asset (stock) is moving in an uptrend, and the opposite means the asset is in a downtrend.
How is this different?
Uses multiple calculations to produce signals for an indicator than normally doesn't have any.
Multiple ADX's, +DI's, and -DI's for better accuracy and clearer direction changes.
Ability to use 2 different background highlight signals and several buy/sell signals.
Fully customizable (as always), ability to turn on or off any signals, change any of the colors to suit your needs.
Added pre-filled Alerts.
The ribbons created by the fill make it easier to see the change in direction of each plot.
The chart should look like:
Cheers,
Mike
(UPRIGHT TRADING)
