מתנדי ביל וויליאמס


VietNguyen Buy/Sell VipThis is a indicator of Vietnammes. It is very good for you when trade Gold and Crypto

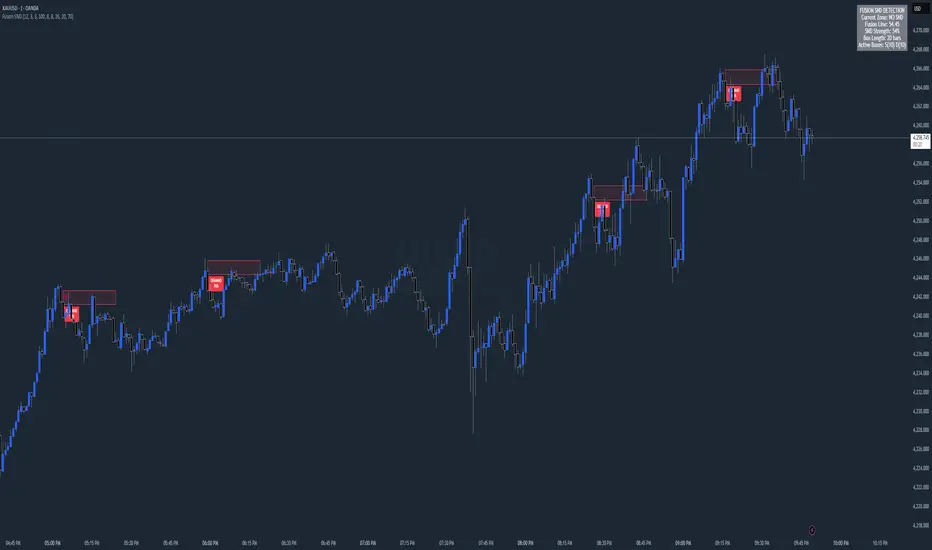
Chart Fusion Line SND Detection by TitikSona🧭 Overview
Fusion Line Momentum Analyzer is a momentum visualization tool that introduces a unified model of oscillator fusion.
It blends Fast and Slow Stochastics with RSI into one adaptive curve, designed to eliminate conflicting signals between different momentum sources.
Instead of reading three separate oscillators, the Fusion Line provides a consolidated view of strength and exhaustion zones in a single framework.
This approach helps analysts detect aligned momentum shifts with greater clarity and less noise, without repainting or lagging methods.
⚙️ Core Concept
Traditional oscillators often provide conflicting readings when volatility changes.
To solve this, the Fusion Line averages three normalized components:
Fast Stochastic (12,3,3) — reacts quickly to short-term momentum spikes.
Slow Stochastic (100,8,8) — filters long-term momentum context.
RSI (26) — measures internal strength between buying and selling pressure.
Each is rescaled to a 0–100 range, then averaged into a single curve called the Fusion Line.
A secondary Signal Line (SMA 9) is added to visualize directional confirmation.
This combination aims to preserve responsiveness from the fast components while maintaining structural stability from the slow and RSI layers.
🌈 Features
Unified momentum curve combining stochastic and RSI dynamics.
Automatic bias shading to highlight dominant trend direction.
Real-time percentage strength meter (visual intensity).
Configurable alert triggers on key momentum zones (20/80).
Clean chart display without unnecessary elements or overlays.
📘 Interpretation
Rising Fusion Line → indicates strengthening bullish momentum.
Falling Fusion Line → indicates strengthening bearish pressure.
Fusion values below 20 → potential oversold recovery.
Fusion values above 80 → possible exhaustion or reversal zone.
Mid-zone movement → reflects equilibrium or sideways momentum.
These readings should always be combined with higher timeframe structure or volume confirmation for context.
⚙️ Default Parameters
Fast Stochastic (12,3,3)
Slow Stochastic (100,8,8)
RSI Length (26)
Signal Line Smoothing (9)
All values can be adjusted to adapt to asset volatility or timeframe conditions.
⚠️ Disclaimer
This indicator is a research and visualization tool, not a signal generator.
It does not predict price movement or guarantee performance.
Use for analytical purposes only and combine with your own trading framework.
👨💻 Developer
Created by TitikSona — Research & Fusion Concept Designer
Built using Pine Script v6
Type: Open-source educational script
💬 Short Description
Fusion-based momentum visualization combining Double Stochastic and RSI into one adaptive line for clearer, noise-free momentum analysis.
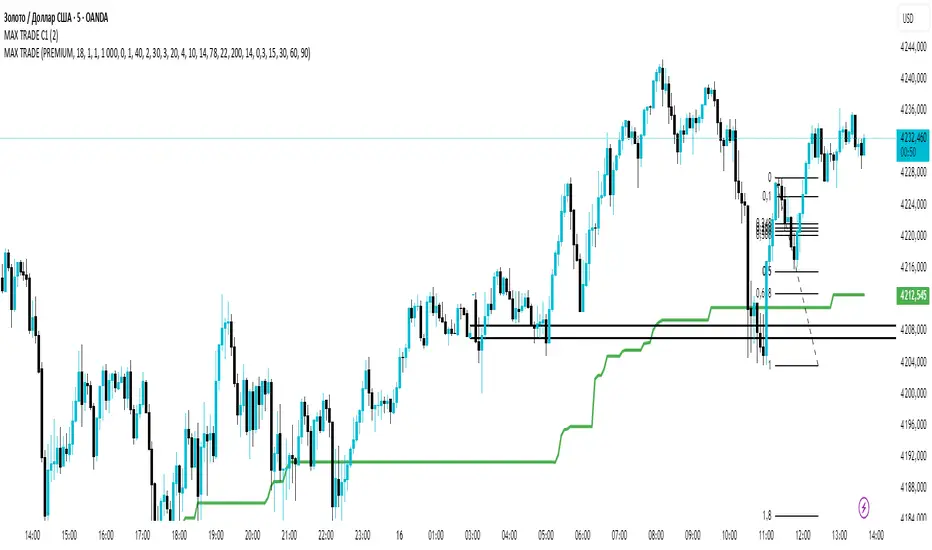
MAX TRADEA professional smart trading indicator built for precision and profitability.
It automatically detects market structure breaks, trendline breaches, and Fibonacci zones to generate high-probability BUY and SELL signals.
Optimized for XAU/USD and crypto pairs, it works best on lower timeframes (M1–M15).
MTF MACD + Accelerator Oscillator Strategy ※日本語説明は英文の下にあります。
Concept:
This is a multi-timeframe trend-following strategy that combines:
Higher timeframe MACD → determines the major trend direction.
Lower timeframe Accelerator Oscillator (AC) → identifies acceleration in momentum for optimal entry timing.
The strategy enters trades in the direction of the higher timeframe trend when the AC shows a momentum acceleration.
Entry Rules:
Long (Buy):
Higher timeframe MACD line > signal line (uptrend)
AC crosses above zero line on the lower timeframe
Short (Sell):
Higher timeframe MACD line < signal line (downtrend)
AC crosses below zero line on the lower timeframe
Exit Rules:
Take Profit: ATR(14) * 1.5 (configurable)
Stop Loss: ATR(14) * 1.0 (configurable)
Exit on opposite signal or if TP/SL is hit
Plotting:
AC is plotted on the chart (green for positive, red for negative)
Buy/Sell signals are marked with small triangles below/above bars
Customization:
Timeframe, MACD parameters, ATR multipliers can be adjusted in the input settings.
Works for scalping, day trading, or swing trading on various instruments.
---------------------------------------------------------------------
コンセプト:
この戦略はマルチタイムフレームのトレンドフォロー型で、以下を組み合わせています:
上位足MACD → 大きなトレンド方向を確認
下位足Accelerator Oscillator(AC) → モメンタム加速のタイミングを捉え、最適なエントリーを判断
上位足のトレンド方向に沿って、下位足でACが勢いの加速を示したタイミングでエントリーします。
エントリールール:
ロング(買い):
上位足MACDライン > シグナルライン(上昇トレンド)
下位足ACが0ラインを上抜け
ショート(売り):
上位足MACDライン < シグナルライン(下降トレンド)
下位足ACが0ラインを下抜け
エグジットルール:
利確:ATR(14) * 1.5(設定可能)
損切り:ATR(14) * 1.0(設定可能)
逆シグナル発生時やTP/SL到達時にも決済
チャート表示:
ACはチャート上にプロット(正なら緑、負なら赤)
買い/売りシグナルはバーの下/上に小さな三角で表示
カスタマイズ:
時間足、MACDパラメータ、ATR倍率は入力設定で変更可能
スキャルピング、デイトレード、スイングトレードなど幅広く利用可能

True Single Line Fusion [by TitikSona]🧠 Full Description
True Single Line Fusion by TitikSona is an open-source oscillator that unifies Fast Stochastic, Slow Stochastic, and RSI into a single smooth momentum line.
It simplifies multi-oscillator analysis into one clear visual — helping traders recognize potential momentum shifts, exhaustion, and reversal zones.
⚙️ Core Logic
The indicator calculates:
Fast Stochastic (12,3,3) → short-term swing sensitivity
Slow Stochastic (100,8,8) → broad trend context
RSI (26) → overall strength and directional bias
All three are normalized (0–100) and averaged to form the Fusion Line, creating a single unified momentum curve.
A Signal Line (SMA-9) and Histogram are added to highlight short-term acceleration or deceleration.
Formula: Fusion = (FastK + SlowK + RSI) / 3
🔍 Interpretation
Fusion Line rising → momentum strengthening upward
Fusion Line falling → momentum weakening
Histogram color (green/red) shows the direction and intensity of the move
Background highlights identify potential extremes:
🟩 Green = potential oversold region
🟥 Red = potential overbought region
💡 How to Use
Works on any symbol and timeframe.
Use the Fusion Line’s direction and slope as momentum context, not as direct buy/sell signals.
Combine with price structure, support/resistance, or volume analysis to confirm potential reversals.
Example:
Fusion Line turning upward from green zone → possible bullish momentum shift
Fusion Line turning downward from red zone → possible bearish exhaustion
📘 Notes
Ideal for identifying turning points in ranging or consolidating markets.
Does not generate automated signals or predictions.
Open-source for learning, modification, and educational use.
Designed for clarity, low lag, and clean visualization.
🧩 Developed and shared by TitikSona — made to unify oscillators into one adaptive momentum tool.

Zark CRT Line/Marker Color & Style Meaning
Previous Candle CRT Green (bullish) / Red (bearish) solid line Sweep confirmed on the previous candle
Current Candle CRT Green (bullish) / Red (bearish) dashed line Sweep currently happening on the current candle
Higher Timeframe CRT Orange dotted line Sweep from higher timeframe shown on lower timeframe chart
Target Line Blue dashed line Opposite side of liquidity for potential price target
Breaker Confirmed Aqua solid line (over previous/current CRT) Sweep confirmed with a break of a small swing
CRT Invalidated Gray line Sweep no longer valid (price closed beyond sweep level)
Full-Height HTF Divider Yellow vertical line Marks each higher timeframe bar for visual separation
Labels White text on colored background Shows type (Prev/Curr/HTF) and exact price

ombs - atr vol ma rsi macdאינדקטור ombs – atr vol ma rsi macd מציג תצוגה חזותית קלה לשימוש של נתוני דשבורד יומיים עיקריים - טווח ממוצע יומי (ATR), ווליום (VOL), ממוצע נע 150, העצמת RSI ו-MACD. העיגולים הצבעוניים מחליפים צבעים לפי חוזק או חולשה במדדים המרכזיים. אידיאלי לאנליסטים וסוחרים שרוצים לראות תמונת מצב טכנית בבת אחת במסך.
The ombs – atr vol ma rsi macd indicator provides a crisp dashboard-style visualization of key daily technical stats: Average True Range (ATR), Volume (VOL), 150-period Moving Average (MA), RSI, and MACD. Colored dots summarize the strength or weakness at a glance for each metric. Perfect for analysts and traders who want an instant technical overview directly on the chart.

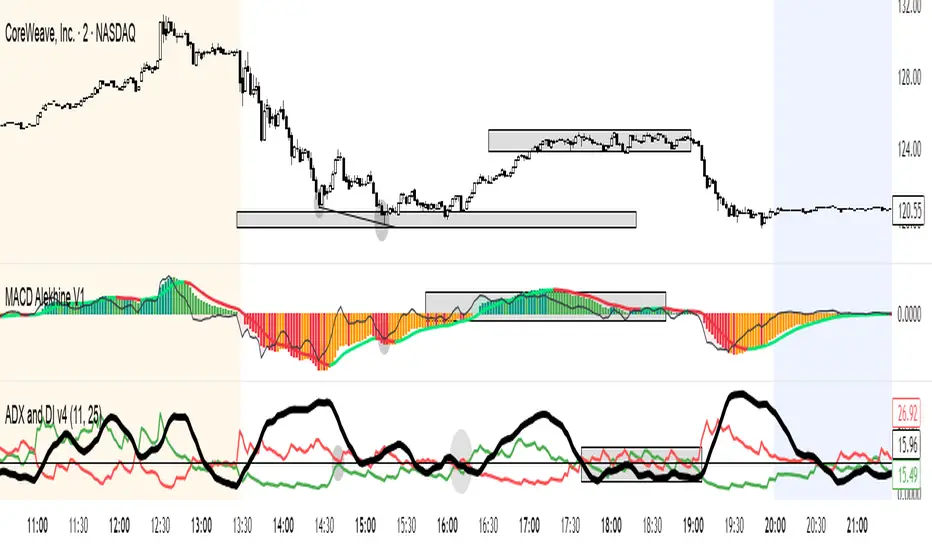
MACD Alekhine V1MACD Alekhine V1 هو مؤشر احترافي متعدد الأطر الزمنية ، ويجسد الدقة الإستراتيجية في قراءة حركة السوق.
يُوحّد هذا المؤشر عدة نماذج من الـ MACD داخل نظام واحد لتقديم رؤية أوضح لقوة الزخم واتجاه السعر.
المكونات الرئيسـية
MACD القياسي (12-26-9) لرصد الزخم العام.
MACD السريع (5-13-1) لمتابعة التسارع اللحظي.
منطق ألوان MACD Color لتوضيح التحولات في الاتجاه بصريًا.
جدول القوة متعدد الأطر (MTF Table) لعرض قوة الاتجاه على الفريمات 4H / 1H / 30m / 15m / 10m / 5m / 3m.
الميزات
نظام MACD مزدوج للرؤية الطبقية لحركة السوق.
ألوان ديناميكية تفاعلية مع الزخم.
جدول قوة موحّد بين الأطر الزمنية.
إعدادات مرنة للألوان، الشفافية، وحجم الجدول، مع توافق كامل للأجهزة المحمولة.
المراجع
MACD Color — كمصدر مجاني مفتوح للمنطق اللوني.
MACD 12-26-9 القياسي.
MACD 5-13-1 السريع.
جميع عمليات الدمج والتعديل البرمجي تمت يدويًا من قِبل الناشر.
إخلاء مسؤولية هذا المؤشر مخصص لأغراض التحليل الفني والتعليم فقط،
ولا يُعتبر توصية بيع أو شراء أو استثمار مالي.
يُنصح المستخدم بالاعتماد على تحليله الخاص قبل اتخاذ قرارات التداول.
يتوافق هذا المؤشر مع سياسات النشر وحماية الملكية الفكرية في TradingView.
♟️ MACD Alekhine V1 — Multi-Timeframe Momentum System
📈 Concept & Structure
MACD Alekhine V1 is a professional multi-timeframe momentum indicator , symbolizing precision, strategy, and calculated movement.
This tool merges multiple MACD models into a single, cohesive framework for high-clarity momentum and trend visualization.
It integrates:
Standard MACD (12-26-9) for core momentum and trend strength visualization.
Fast MACD (5-13-1) for short-term acceleration tracking.
MACD Color logic as a visual reference for histogram and signal-line color dynamics.
Compact MTF Strength Table for normalized trend strength across multiple timeframes: 4H, 1H, 30m, 15m, 10m, 5m, and 3m.
⚙️ Key Features
Dual MACD System: Combines slow and fast MACD models for layered market insight.
Adaptive Color Logic: Derived from MACD Color, providing clear visual differentiation between rising and weakening trends.
Normalized Strength Table: Multi-timeframe heatmap that measures standardized MACD momentum strength.
Customizable Interface: Adjust histogram opacity, table position and size, color palette, and overall scaling — optimized for mobile users.
🧩 References
Conceptually based on:
MACD Color (for histogram & signal logic).
MACD 12-26-9 (standard model).
MACD 5-13-1 (fast-momentum model).
All implementations and integrations are custom-coded by the author.
⚠️ Disclaimer
This indicator is designed for analytical and educational use only.
It does not constitute financial advice or a trading recommendation.
Users should conduct independent verification before making any investment or trading decision.
This script fully complies with TradingView’s publishing and content policies.
---
🏷️ Suggested Publishing Details
Title: MACD Alekhine V1 — Multi-Timeframe Momentum System
Short Description:
Dual-MACD system with adaptive color logic and compact MTF strength matrix.
Tags: macd, momentum, multi-timeframe, trend, strength, color
MACD PRO 5-13-1 + MTFMACD Alekhine V1 هو مؤشر احترافي متعدد الأطر الزمنية ، ويجسد الدقة الإستراتيجية في قراءة حركة السوق.
يُوحّد هذا المؤشر عدة نماذج من الـ MACD داخل نظام واحد لتقديم رؤية أوضح لقوة الزخم واتجاه السعر.
المكونات الرئيسـية
MACD القياسي (12-26-9) لرصد الزخم العام.
MACD السريع (5-13-1) لمتابعة التسارع اللحظي.
منطق ألوان MACD Color لتوضيح التحولات في الاتجاه بصريًا.
جدول القوة متعدد الأطر (MTF Table) لعرض قوة الاتجاه على الفريمات 4H / 1H / 30m / 15m / 10m / 5m / 3m.
الميزات
نظام MACD مزدوج للرؤية الطبقية لحركة السوق.
ألوان ديناميكية تفاعلية مع الزخم.
جدول قوة موحّد بين الأطر الزمنية.
إعدادات مرنة للألوان، الشفافية، وحجم الجدول، مع توافق كامل للأجهزة المحمولة.
المراجع
MACD Color — كمصدر مجاني مفتوح للمنطق اللوني.
MACD 12-26-9 القياسي.
MACD 5-13-1 السريع.
جميع عمليات الدمج والتعديل البرمجي تمت يدويًا من قِبل الناشر.
إخلاء مسؤولية هذا المؤشر مخصص لأغراض التحليل الفني والتعليم فقط،
ولا يُعتبر توصية بيع أو شراء أو استثمار مالي.
يُنصح المستخدم بالاعتماد على تحليله الخاص قبل اتخاذ قرارات التداول.
يتوافق هذا المؤشر مع سياسات النشر وحماية الملكية الفكرية في TradingView.
♟️ MACD Alekhine V1 — Multi-Timeframe Momentum System
📈 Concept & Structure
MACD Alekhine V1 is a professional multi-timeframe momentum indicator , symbolizing precision, strategy, and calculated movement.
This tool merges multiple MACD models into a single, cohesive framework for high-clarity momentum and trend visualization.
It integrates:
Standard MACD (12-26-9) for core momentum and trend strength visualization.
Fast MACD (5-13-1) for short-term acceleration tracking.
MACD Color logic as a visual reference for histogram and signal-line color dynamics.
Compact MTF Strength Table for normalized trend strength across multiple timeframes: 4H, 1H, 30m, 15m, 10m, 5m, and 3m.
⚙️ Key Features
Dual MACD System: Combines slow and fast MACD models for layered market insight.
Adaptive Color Logic: Derived from MACD Color, providing clear visual differentiation between rising and weakening trends.
Normalized Strength Table: Multi-timeframe heatmap that measures standardized MACD momentum strength.
Customizable Interface: Adjust histogram opacity, table position and size, color palette, and overall scaling — optimized for mobile users.
🧩 References
Conceptually based on:
MACD Color (for histogram & signal logic).
MACD 12-26-9 (standard model).
MACD 5-13-1 (fast-momentum model).
All implementations and integrations are custom-coded by the author.
⚠️ Disclaimer
This indicator is designed for analytical and educational use only.
It does not constitute financial advice or a trading recommendation.
Users should conduct independent verification before making any investment or trading decision.
This script fully complies with TradingView’s publishing and content policies.
---
🏷️ Suggested Publishing Details
Title: MACD Alekhine V1 — Multi-Timeframe Momentum System
Short Description:
Dual-MACD system with adaptive color logic and compact MTF strength matrix.
Tags: macd, momentum, multi-timeframe, trend, strength, color

VNREAL-ExVG (ex VHM, VRE, IDC) — rebased=100 — no-arraysVNREAL-ExVG (ex VHM, VRE, IDC) — rebased=100 — no-arrays

ALMASTO – Pro Trend & Momentum (v1.1)ALMASTO — Pro Trend & Momentum Strategy
Description:
This strategy is designed for precision trading in both Forex (FX) and Crypto markets.
It combines multi-timeframe trend confirmation (EMA200), momentum filters (RSI, MACD, ADX), and ATR-based dynamic risk management.
ALMASTO — Pro Trend & Momentum Strategy automatically manages take-profit levels, stop-loss, and breakeven adjustments once TP1 is reached — providing a structured and emotion-free trading approach.
Optimal Use
Works best on lower timeframes (5m–15m) with strong liquidity sessions.
Optimized for pairs like EURUSD, XAUUSD, and BTCUSDT.
Built for trend-following setups and momentum reversals with high volatility confirmation.
Recommended Settings
🔹 Forex – 5m
EMA Fast = 34, EMA Slow = 200, HTF = 1H
RSI (14): Long ≥ 55 / Short ≤ 45
MACD (8 / 21 / 5), ADX Len 10 / Min 27
ATR Len 7, Stop Loss = ATR × 2.1
TP1 = 1.1 RR, TP2 = 2.3 RR
Session = 07:00–11:00 & 12:30–16:00 (Exchange Time)
Risk = 0.8% per trade
🔹 Forex – 15m
EMA Fast = 50, EMA Slow = 200, HTF = 4H
RSI (14): Long ≥ 53 / Short ≤ 47
MACD (12 / 26 / 9), ADX Min 24
ATR Len 10, SL = ATR × 1.9
TP1 = 1.2 RR, TP2 = 2.6 RR
Risk = 1.0% per trade
🔹 Crypto – 5m (BTC/USDT)
EMA Fast = 34, EMA Slow = 200, HTF = 4H
RSI (14): Long ≥ 56 / Short ≤ 44
MACD (8 / 21 / 5), ADX Min 30
ATR Len 7, SL = ATR × 2.2
TP1 = 1.0 RR, TP2 = 2.5 RR
Session = 00:00–06:00 & 12:00–22:00 (UTC)
Risk = 0.5% per trade
Core Features
✅ Auto breakeven after TP1
✅ Dual take-profit system (1:1 & 1:2 RR)
✅ ATR-based stop & trailing logic
✅ Filters for session time, volume, and volatility
✅ Candle-body vs ATR size filter to avoid noise
✅ Optional cooldown between trades
Important Notes
Use bar close confirmation only (barstate.isconfirmed) to avoid repainting on lower timeframes.
Adjust commission (0.01–0.03%) and slippage (1–2 ticks) in Strategy Tester for realistic results.
Avoid low-liquidity hours (after 21:00 UTC for FX / after midnight for crypto).
Backtest using realistic broker data (e.g., BlackBull Markets / Bybit / Binance Futures).
Best results occur during London & New York sessions with moderate volatility.
⚠️ Disclaimer
This script is for educational and research purposes only.
It does not constitute financial advice.
Use proper risk management and test thoroughly before using on live accounts.
Developed by KING FX Labs
Built and optimized by Yousef Almasto — combining advanced price-action logic, multi-timeframe EMA structure, and volatility-adaptive ATR management.
Tested across Forex, Gold, and Crypto markets to ensure consistent performance and minimal drawdown.
📈 “Precision Trading. Zero Emotion. Pure Momentum.”


Inverse VIX / Custom Inverse Line🎯 Main Idea
This indicator creates a line that moves opposite to the VIX (Volatility Index) — or any symbol you choose.
When VIX rises (fear increases), → this line goes down.
When VIX falls (market calm), → this line goes up.
It helps you visually understand market sentiment — calm periods (bullish) vs fear periods (bearish).
⚙️ Input Settings
Setting Description
Symbol to invert The symbol to invert. Default is CBOE:VIX.
Inverse mode The method used to invert the values. There are 3 options:
① Negate Simply flips the sign (multiplies by -1). Very straightforward.
② Reciprocal Uses the mathematical inverse (1 ÷ value). High values become smaller, and vice versa.
③ Inverse Normalized The most useful mode 🔥 — normalizes values between 0–100 and flips them, similar to an RSI.
Normalization lookback How many bars to use for normalization (default 252 = roughly one trading year).
Smoothing (SMA) Number of bars for smoothing (makes the line smoother).
Use log for reciprocal Uses logarithmic scaling to stabilize big swings.
Plot color / width Customize the line’s color and thickness.
Show original source If enabled, shows the original VIX line for comparison.
📈 How It Works
The script fetches the close price of the VIX (or your chosen symbol).
It applies the selected inversion method.
The inverted line is plotted on the chart.
In “Inverse Normalized” mode:
The range is 0–100.
Values above 75 = high optimism (market often overheated).
Values below 25 = high fear (potential buying opportunity).
A middle line at 50 marks neutral sentiment.
⚠️ Alerts
The indicator includes two default alerts when using “Inverse Normalized” mode:
🔔 Above 75: Market showing strong optimism (potential top or correction zone).
🔔 Below 25: Market showing fear (potential bottom or buy signal).
🧠 How to Use It
Use it on daily or weekly charts for clearer signals.
Compare it with SPX or NASDAQ:
When the Inverse VIX line rises, markets often go up.
When it falls, markets usually drop or consolidate.
Combine it with other indicators (e.g., RSI, MACD) for confirmation.

Bala RSI + BLOCKSThis indicator combines RSI momentum analysis with order block detection to highlight high-probability reversal and continuation zones. It’s designed for traders who want to align institutional footprints with momentum exhaustion or strength.
✅ Key Features
Automatic Order Block Detection
Identifies bullish and bearish order blocks based on price structure shifts and liquidity zones.
RSI-Driven Confirmation
Uses RSI to filter or validate order blocks (e.g., oversold for bullish zones, overbought for bearish zones).
Clear Visual Marking
Highlights order blocks directly on the chart for quick decision-making.
Works Across Timeframes
Suitable for intraday, swing, and positional strategies.
🎯 Use Cases
Spot potential reversal zones with RSI confluence
Confirm order blocks with momentum exhaustion
Combine with price action for refined entries/exits
⚠️ Disclaimer
This tool is for educational and analytical use only. It does not constitute financial advice. Always combine with your own strategy and risk management.

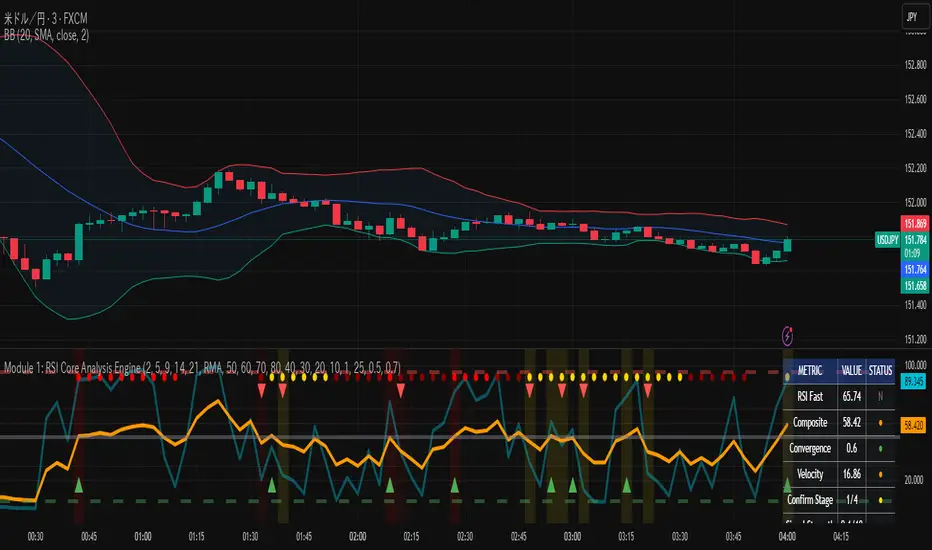
RSI Core Analysis EngineHI traders
This tool employs a higher-sensitivity RSI than conventional settings to capture market shifts earlier.
When the Ultra Fast RSI (UF) approaches upper or lower extremes, short-term profit-taking or pullbacks tend to occur, and a crossover between UF and the Composite RSI can serve as a signal of a regime change.
However, in strong trends the RSI can remain pinned for extended periods, so combine it with ADX, volume, and volatility measures to improve accuracy.
While early detection is an advantage, it also increases noise. This tool uses a four-stage confirmation process (DMI/ADX → MACD/Stochastics/RSI acceleration → five-layer alignment) and quality/confidence scores to filter for higher-expectancy setups.
It will not be effective in every market condition. Use it with predefined stop-losses and prudent position sizing.
-------------------------------------------------------------------------------------------------------
Strongly recommended preset (because the indicator packs many features):
Step 1 — Inputs tab
Center Level: 50
OB1: 60, OB2: 70, OB3: 95
OS1: 40, OS2: 30, OS3: 5
Step 2 — Style tab
✅ Ultra Fast RSI — Thickest
✖ Fast RSI
✖ Medium RSI
✖ Standard RSI
✖ Slow RSI
✅ Composite RSI — Thickest
✅ Stage Indicator
✖ RSI Velocity
✖ RSI Acceleration
✅ Quality Score
✅ Bullish Cross
✅ Bearish Cross
✅ Strong Signal Background
Levels:
・✅ Center 50 — Thickest
・✅ OB1 60, OB2 70, OB3 95 (thicker)
・✅ OS1 40, OS2 30, OS3 5 (thicker)
-------------------------------------------------------------------------------------------------------------
thats enough
have a nice trade
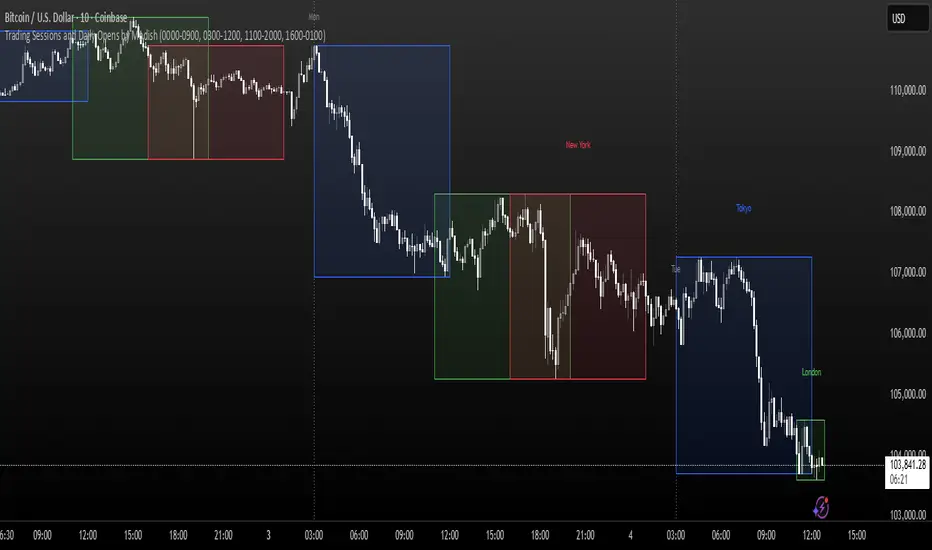
Trading Sessions and Daily Opens by ModishThis Pine Script indicator overlays key forex trading sessions (Sydney, Tokyo, London, New York) on your chart using Kenyan time (EAT/UTC+3), with customizable translucent boxes, borders, and labels positioned neatly above each session for clear visualization. It also plots dotted vertical lines at daily opens (Monday-Friday) with abbreviated day labels for quick reference. Toggle sessions on/off, adjust colors, and ensure seamless integration with candlesticks for dynamic, real-time analysis. Ideal for session-based traders seeking precise timing and structure.
Quanloki + ICT Smart Entry (v7.3 Pivot Entry Only + BB)If you need a signal group or team, please contact @quanloki or tele to get support and refund for the VIP group.
UmutTrades — Dynamic Buy/Sell Bubbles (stable)This indicator detects large buy and sell transactions based on user-defined thresholds (either in base units or quote value).
It places colored bubbles on the chart where those big orders occur green for buys and red for sells with the bubble’s color intensity and size reflecting how large the order is relative to your threshold.
Williams Alligator Spread Oscillator (WASO)Short description (About box)
Williams Alligator Spread Oscillator (WASO) converts Bill Williams’ Alligator into a 0–100 oscillator that measures the average distance between Lips/Teeth/Jaw relative to ATR. High = expansion/trend (default), low = compression/range — making sideways markets easier to spot. Includes adaptive normalization, configurable thresholds, background shading, and alerts.
Full description (Description field)
What it does
The Williams Alligator Spread Oscillator (WASO) transforms Bill Williams’ Alligator into a single, adaptive 0–100 scale. It computes the average pairwise distance among the Alligator lines (Lips/Teeth/Jaw), normalizes it by ATR and a rolling min–max window, and smooths the result. This makes the signal robust across symbols and timeframes and explicitly improves detection of sideways (ranging) conditions by highlighting compression regimes.
Why it helps
Sideways detection made easier: Low WASO marks compressed regimes that commonly align with consolidation/range phases, helping you identify chop and plan breakout strategies.
Trend/expansion clarity: High WASO indicates the Alligator lines are widening relative to volatility, pointing to trending or expanding conditions.
You can flip the direction if you prefer “High = Range.”
How it is calculated (plain English)
Smooth price with RMA (SMMA-like) to get Jaw, Teeth, Lips.
Compute the average pairwise distance between these three lines.
Divide by ATR to remove price-scale effects.
Normalize with a rolling min–max window to map values to 0–100.
Optionally apply EMA smoothing to the oscillator.
Key settings
Jaw/Teeth/Lips Lengths: Alligator periods (SMMA-like via ta.rma).
ATR Length: Volatility benchmark for scaling.
Normalization Lookback: Longer = steadier; shorter = more responsive.
Smoothing (EMA): Evens out noise.
High Value = Large Spread (Trend): Toggle to invert semantics.
Upper/Lower Thresholds: 70/30 are practical starting points.
Signals / interpretation
Sideways / Compression (easier to spot):
Default direction: WASO below Lower Threshold (e.g., <30).
With inverted direction OFF: WASO above Upper Threshold (e.g., >70).
Trend / Expansion:
Default direction: WASO above Upper Threshold (e.g., >70).
With inverted direction OFF: WASO below Lower Threshold (e.g., <30).
Midline (50): Neutral zone; flips around 50 can hint at regime shifts.
Alerts included
Range Start (sideways/compression)
Trend Start (expansion/trend)
Notes & limitations
This implementation omits the classic forward shift of Alligator lines to keep signals usable on live bars.
If market behavior shifts (very quiet or very volatile), tune Lookback and ATR Length.
Combine WASO with breakout levels or momentum filters for entries/exits.
Credits & disclaimer
Inspired by Bill Williams’ Alligator.
For educational purposes only. Not financial advice.
Release Notes (v1.0):
Initial release of Williams-Alligator Spread Oscillator (WASO) with ATR-based scaling and adaptive 0–100 normalization.
Direction toggle (High = Trend by default), adjustable thresholds, background shading, and two alert conditions.

9:30 USA OPENEasy if it go up it will turn green and you can lng if it goes down it will turn red and you can short

BluePrint SessionsBlueprint Sessions is a multi-session visual tool designed to help traders identify the three most important global market opens with precision.
Features:
Adaptive to chart timezone — sessions automatically adjust to the time zone you select in TradingView.
Three Key Market Sessions:
Asian Session
London Session
New York Session
