Not only a Supertrend [by Oberlunar]Oberlunar’s Not only Supertrend is designed for traders who need something that stays reactive in fast regimes without collapsing when the tape turns discontinuous—volume gaps, microstructure noise, sudden volatility shocks.
The design goal is to approximate market regime dynamics by combining a probability-like regime score (a bounded Bayesian-style posterior from multiple evidence) with a measure of regime impulse (the Kalman-filtered step/change in evidence).
For ETF-like tapes, it models second-order behaviour: volatility expansion vs contraction, persistence of the expansion, and participation/flow confirmation proxies (via multi-broker OHLCV pressure dominance), to reduce sensitivity to transient spikes.
There is no type of lookahead bias or repaint:
More or less 2 R in a 10-minute chart...
The core signal is built around two regime proxies that are intentionally different, so they don’t fail in the same way when the tape gets stressed.
The first proxy looks at realised volatility computed from log-returns, then maps it into a rolling percentile range. Framing volatility this way keeps it scale-free and easier to compare across instruments and across very different volatility states, and it also helps avoid the typical warping you can get from raw ATR-like measures when the market produces abrupt jumps.
The second proxy focuses on Bollinger Band width, but not in absolute terms: it measures the width relative to its own EMA baseline, and then compresses that ratio through a logistic mapping. This keeps the regime evidence continuous, smoothly saturating, and far less prone to “threshold artefacts” where a tiny change flips the state.
Put together, these two pieces produce an “ expansion base ” and a “ contraction base ” that stay bounded and well-behaved, even when price action prints discontinuities.
Then, directional bias is handled as a soft prior that can lean the model without overpowering it. In practice, a weighted multi-timeframe RSI builds a probability-like prior over long versus short bias, so the engine can express partial conviction and gracefully reconcile conflicts across timeframes instead of forcing a single, binary view.
That separation matters in situations where directional edge and volatility regime edge are related but not the same thing. The design keeps them coupled—so strong direction can reinforce regime confidence—but it does not collapse them into one signal.
For that reason, the system works with four parallel channels— expansion-long, expansion-short, contraction-long, contraction-short —as continuous evidence streams. And when price breaks the Bollinger bands, it’s treated as a conditional boost to the relevant evidence instead of an absolute trigger, which helps reduce false positives during noisy, stop-run style breakouts.
You can use a not only Supertrend line style with signals...
...or just follow its planes and their breakout, such in the following example:
To keep the system resilient to gaps and one-bar anomalies, the raw evidence doesn’t go straight into decisions: it is first passed through an alpha–beta Kalman update. In practical terms, this acts as a lightweight state-space tracker that follows both the level of the evidence and its drift .
The level is your smoothed, probability-like regime proxy. The drift is the key ingredient for options, because it captures how quickly the regime is changing—what you can reasonably describe as the acceleration of the transition.
Crucially, the script doesn’t just compute that internally and forget it: it explicitly takes the step of the filtered state, normalises it, and uses it as a feature. That lets the engine distinguish between a regime that is high but basically flat, and a regime that is actively ramping. And because one-bar spikes can still happen, the step feature is bounded, so it can react to real transitions without overreacting to a single print.
The final confidence layer is produced with a Bayesian-style update that treats both the prior and the incoming evidence as **pseudo-counts in a Beta distribution**, and then uses the **posterior mean** as the final probability-like score. The prior is derived from the weighted multi-timeframe RSI: the script maps the weighted RSI into a smooth probability via a sigmoid (`rsiPriorLong`), and uses its complement for short bias (`rsiPriorShort`).
The likelihood is built per channel, and it is deliberately simple and bounded. For expansion, the likelihood combines the Bollinger expansion signal with the normalised Kalman step , using user-controlled weights. Contraction does the same with the corresponding contraction signals. Small conditional boosts are then applied when the price breaks the bands (or stays inside them), but these boosts remain incremental rather than flipping the state.
The two strength parameters, `kPrior` and `kLike`, control how “ sticky ” this posterior is. A higher `kPrior` makes the posterior lean more strongly on the RSI-based belief and therefore move more smoothly. A higher `kLike` gives more authority to the incoming evidence (BB regime + Kalman step), so the posterior adapts faster when conditions change.
In effect, this is a practical calibration layer: instead of stacking indicators and hoping they agree, the script converts each component into bounded evidence, fuses them into a single posterior mean, and exposes explicit controls for stability versus responsiveness—exactly the trade-off you typically care about when dealing with convex instruments, where you want confidence to be reactive, but not fragile.
Bands filled by expansion Bayesian posterior:
Because regime detection alone isn’t enough to avoid whipsaws, the script adds an adaptive “lane supertrend” layer. This supertrend layer is not built upon a classic ATR. Instead of operating on price distance, it operates on posterior imbalance : the engine computes a net score as the difference between bullish and bearish posteriors (`netE = postEL - postES` for expansion and `netC = postCL - postCS` for contraction), and that net is what drives direction.
Direction changes are then gated by an adaptive deadband .
In turn, the deadband is not fixed: it expands or contracts based on two things that already exist in the model— posterior confidence (e.g., `confE = max(postEL, postES)`) and regime intensity (e.g., `regE = volPct01`, and the complementary contraction regime). Those are mixed to produce `dbE` and `dbC`, which act like a hysteresis zone around neutrality.
When the posterior is indecisive and the regime is noisy, the deadband effectively widens, so small oscillations around zero don’t cause constant flips. When the posterior becomes decisive, the deadband tightens, and the direction logic becomes more responsive.
On top of that, flips are not allowed instantly: the script uses a flip-confirm counter that requires the net score to stay beyond the deadband for multiple bars before a direction switch is accepted. This prevents the engine from toggling on micro-oscillations and single-bar disturbances.
Visually, the “lane” is explicitly mapped into price space .
In detail, the script builds a lane geometry using ATR as a vertical scale, then projects the net posterior into the expansion and contraction band. With optional trailing enabled, the lane value is further “supertrend-like”, so what you see on the chart reads as a probabilistic supertrend line —a line whose position and persistence reflect posterior imbalance—rather than a raw volatility expression.
Finally, to address real-world tape issues (discontinuities, fragmented liquidity, venue noise), the script integrates a multi-broker Volumetric Dominance filter as an additional gate. It aggregates multi-broker OHLCV, derives a pressure-like proxy, and only allows certain triggers when cross-broker dominance is sufficiently aligned—so the system is less likely to react to isolated prints that aren’t supported by broader participation.
Once dominance is both directional and concentrated, the filter becomes a hard regime-consistency gate. If dominance is meaningfully bearish, the script blocks bullish expansion triggers and symmetrically blocks bearish expansion triggers when dominance is bullish. In other words, it’s not trying to “confirm” signals after the fact; it enforces a consistency constraint between volatility-expansion regime and cross-venue participation direction, specifically to reduce the exact kind of false positives that can wreck options entries: apparent volatility expansion occurring into opposing flow.
Thus, this is not only a Supertrend. It’s a bounded, smooth regime engine with an outlier-resistant “acceleration” step, a Bayesian-style posterior with tunable inertia, and a dominance gate that blocks expansion signals when multi-venue pressure points the other way.
It can still fail—no proxy fully captures the tape, and any filter can lag or miss abrupt turns—but I think it’s a framework worth exploring for more informed entries across assets: responsive in fast regimes, yet less fragile around gaps and volatility shocks.
Enjoy!
by Oberlunar 👁★
רוחב רצועות בולינג'ר (BBW)

RSI & BB Oversold Scalper with MACD Confirmation [DotGain]RSI & BB Oversold Scalper with MACD Confirmation
The RSI & BB Oversold Scalper is a mean reversion / dip-buying indicator designed for traders who want to combine oversold conditions with momentum confirmation .
It uses a multi-step logic: first detect an oversold setup, then wait for a MACD confirmation within a defined time window before issuing a buy signal.
---
Core Concept
1. Detect an oversold setup using Bollinger Bands %b, RSI and an optional DSS filter
2. Keep the setup active for a limited number of candles
3. Trigger the entry using a MACD bullish crossover
4. Reset after entry to avoid multiple signals from the same setup
---
Buy Signal Logic
A buy signal is generated when the following conditions are met:
1. Oversold Setup (filters can be enabled/disabled individually)
• Bollinger Bands %b Oversold (Lookback-based)
The price has traded below the lower Bollinger Band at least once within the last `lookbackBB` candles.
• RSI Oversold (Lookback-based)
The RSI has dropped below 30 at least once within the last `lookbackRSI` candles.
• DSS (Double Smoothed Stochastic) Reversal Filter
A bullish crossover of the DSS line above its signal line while the DSS value is below 20 , indicating a potential momentum reversal from oversold conditions.
Note:
BB %b and RSI are lookback filters , while the DSS condition is a single-bar crossover event .
---
2. MACD Confirmation (Entry Timing)
After the setup becomes active, the indicator waits for a bullish MACD crossover (`MACD line crosses above Signal line`) within a user-defined time window (`validWindow` candles).
If the MACD confirmation occurs within this window, a buy signal is printed.
If the window expires without confirmation, the setup is discarded automatically.
---
Reset Logic
• After a buy signal, the setup is reset immediately
• Only one signal is allowed per setup
• No late entries after the time window expires
---
Inputs & Customization
• Enable or disable BB, RSI and DSS filters individually
• Adjust lookback periods to control how recent oversold conditions must be
• Tune the MACD confirmation window to balance early vs. conservative entries
Smaller windows = faster, more aggressive entries
Larger windows = fewer but more confirmed signals
Recommended Markets & Timeframes
• Cryptocurrencies, Forex, Indices, liquid stocks
• Best suited for 1m – 15m scalping
• Also usable on 15m – 1h for slower mean-reversion trades
Visuals
• Buy signals are displayed as labels below the price candles
Important Notes
• This indicator is a signal and timing tool , not a complete trading system
• Always combine with higher-timeframe trend, support/resistance or volume analysis
• Backtesting and paper trading are strongly recommended
Disclaimer:
This "RSI & BB Oversold Scalper with MACD Confirmation" (Oversold Scalper) indicator is provided for informational and educational purposes only. It does not, and should not be construed as, financial, investment, or trading advice.
The signal generated by this tool (Green) is the result of a specific set of algorithmic conditions. They are not a direct recommendation to buy or sell any asset. The indicator's purpose is to highlight possible weakness in the markets, not to provide infallible trade signals.
All trading and investing in financial markets involves a substantial risk of loss. You can lose all of your invested capital.
Past performance is not indicative of future results. Even an indicator designed to filter out "chop" may produce false, lagging, or losing signals. Markets can remain unpredictable longer than you can remain solvent.
The creator DotGain assumes no liability for any financial losses or damages you may incur, directly or indirectly, as a result of using this indicator or the information it provides.
You are solely responsible for your own trading and investment decisions. Always conduct your own research (DYOR), validate signals with other methods, and consider your personal risk tolerance before entering any trade.

BT State, Structure & EnergyBT State, Structure & Energy
BT State, Structure & Energy is a market context framework — not a signal generator.
It helps traders understand when meaningful outcomes are possible, before interpreting absorption, aggression, or entries.
This tool enforces the correct analytical hierarchy used by professional traders.
---
Core Concept
Markets resolve in layers, not signals.
This indicator separates volatility behavior into three distinct components:
State (BBWP) → Can something happen?
Structure (Keltner Width %) → Is the market opening or compressing?
Energy (ATR %) → Is there enough participation to traverse structure?
Most traders invert this sequence and fail.
This framework does not.
---
Indicator Mapping
BBWP → State
Defines volatility regime and expansion permission.
Keltner Width % → Structure
Tracks the opening and closing of the market’s price envelope.
ATR % → Energy
Measures the arrival and decay of kinetic participation.
These are non-directional metrics. They describe environment, not bias.
---
Visual Design
BBWP Columns (Heatmap)
Low opacity columns show volatility state without overpowering price.
Compression Background
Subtle shading highlights regimes where expansion is statistically unlikely.
Structure Line (KWP)
User-defined base color with light/dark slope variants.
Energy Line (ATR %)
User-defined base color with light/dark slope variants.
Brightness reflects slope (rising or falling), not direction.
---
How to Use
Start with State
If volatility permission is closed, most signals will fail.
Then read Structure
Structure often opens before state transitions.
Then read Energy
Energy confirms whether structure can be traversed.
Only then interpret Absorption
Absorption matters when expansion is allowed.
Finally read Aggression
Aggression answers who is winning right now .
Correct hierarchy:
Market State → Absorption → Aggression
---
Best Practices
Do not use this as an entry signal
Use it to filter false breakouts and chop
Pair with absorption and order-flow tools
Use higher opacity on HTF, lower on LTF
Adjust slope length per timeframe (longer on HTF)
---
Who This Is For
This tool is designed for traders who want to:
Understand market condition before acting
Avoid chasing activity in compressed regimes
Trade with context instead of indicators in isolation
If you are looking for buy/sell arrows, this is not the tool.
If you want to know where you are , this is exactly the tool.
---
BT State, Structure & Energy
Understand the environment before interpreting the tape.

Bollinger Band ToolkitBollinger Band Toolkit
An advanced, adaptive Bollinger Band system for traders who want more context, precision, and edge.
This indicator expands on the classic Bollinger Bands by combining statistical and volatility-based methods with modern divergence and squeeze detection tools. It helps identify volatility regimes, potential breakouts, and early momentum shifts — all within one clean overlay.
🔹 Core Features
1. Adaptive Bollinger Bands (σ + ATR)
Classic 20-period bands enhanced with an ATR-based volatility adjustment, making them more responsive to true market movement rather than just price variance.
Reduces “overreacting” during chop and avoids bands collapsing too tightly during trends.
2. %B & RSI Divergence Detection
🟢 Green dots: Positive %B divergence — price makes a lower low, but %B doesn’t confirm (bullish).
🔴 Red dots: Negative %B divergence — price makes a higher high, but %B doesn’t confirm (bearish).
✚ Red/green crosses: RSI divergence confirmation — momentum fails to confirm the price’s new extreme.
These signals highlight potential reversal or slowdown zones that are often invisible to the naked eye.
3. Bollinger Band Squeeze (with Volume Filter)
Yellow squares (■) show periods when Bollinger Bands are at their narrowest relative to recent history.
Volume confirmation ensures the squeeze only triggers when both volatility and participation contract.
Often marks the “calm before the storm” — breakout potential zones.
4. Multi-Timeframe Breakout Markers
Optionally displays breakouts from higher or lower timeframes using different colors/symbols.
Lets you see when a higher timeframe band break aligns with your current chart — a strong trend continuation signal.
5. Dual- and Triple-Band Visualization (±1σ, ±2σ, ±3σ)
Optional inner (±1σ) and outer (±3σ) bands provide a layered volatility map:
Price holding between ±1σ → stable range / mean-reverting behavior
Price riding near ±2σ → trending phase, sustained momentum
Price touching or exceeding ±3σ → volatility expansion or exhaustion zone
This triple-band layout visually distinguishes normal movement from statistical extremes, helping you read when the market is balanced, expanding, or approaching its limits.
⚙️ Inputs & Customization
Choose band type (SMA/EMA/SMMA/WMA/VWMA)
Adjust deviation multiplier (σ) and ATR multiplier
Toggle individual features (divergence dots, squeeze markers, inner bands, etc.)
Multi-timeframe and colour controls for advanced users
🧠 How to Use
Watch for squeeze markers followed by a breakout bar beyond ±2σ → volatility expansion signal.
Combine divergence dots with RSI or price structure to anticipate slowdowns or reversals.
Confirm direction using multi-timeframe breakouts and volume expansion.
💬 Why It Works
This toolkit transforms qualitative chart reading (tight bands, hidden divergence) into quantitative, testable conditions — giving you objective insights that can be backtested, coded, or simply trusted in live setups.

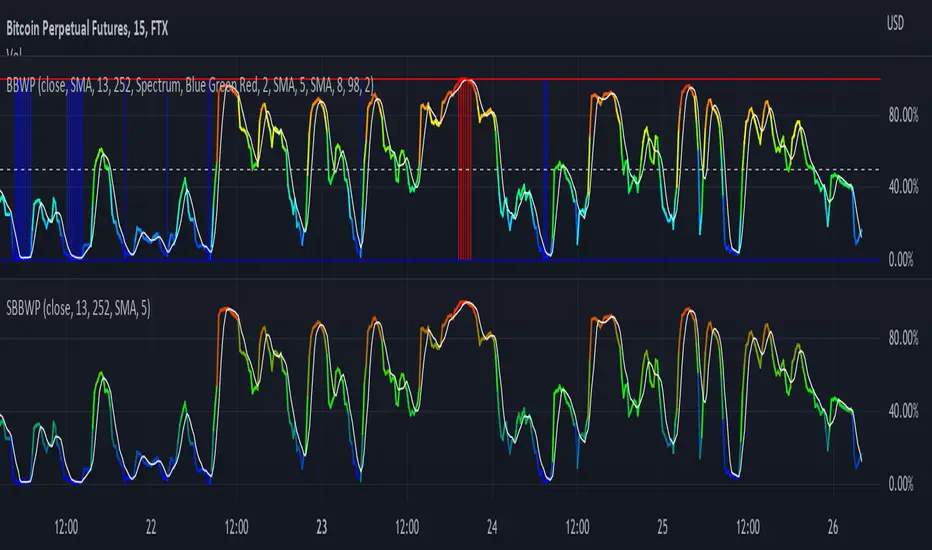
John Bollinger's Bollinger BandsJapanese below / 日本語説明は下記
This indicator replicates how John Bollinger, the inventor of Bollinger Bands, uses Bollinger Bands, displaying Bollinger Bands, %B and Bandwidth in one indicator with alerts and signals.
Bollinger Bands is created by John Bollinger in 1980s who is an American financial trader and analyst. He introduced %B and Bandwidth 30 years later.
🟦 What's different from other Bollinger Bands indicator?
Unlike the default Bollinger Bands or other custom Bollinger Bands indicators on TradingView, this indicator enables to display three Bollinger Bands tools into a single indicator with signals and alerts capability.
You can plot the classic Bollinger Bands together with either %B or Bandwidth or three tools altogether which requires the specific setting(see below settings).
This makes it easy to quantitatively monitor volatility changes and price position in relation to Bollinger Bands in one place.
🟦 Features:
Plots Bollinger Bands (Upper, Basis, Lower) with fill between bands.
Option to display %B or Bandwidth with Bollinger Bands.
Plots highest and lowest Bandwidth levels over a customizable lookback period.
Adds visual markers when Bandwidth reaches its highest (Bulge) or lowest (Squeeze) value.
Includes ready-to-use alert conditions for Bulge and Squeeze events.
📈Chart
Green triangles and red triangles in the bottom chart mark Bulges and Squeezes respectively.
🟦 Settings:
Length: Number of bars used for Bollinger Band middleline calculation.
Basis MA Type: Choose SMA, EMA, SMMA (RMA), WMA, or VWMA for the midline.
StdDev: Standard deviation multiplier (default = 2.0).
Option: Select "Bandwidth" or "%B" (add the indicator twice if you want to display both).
Period for Squeeze and Bulge: Lookback period for detecting the highest and lowest Bandwidth levels.(default = 125 as specified by John Bollinger )
Style Settings: Colors, line thickness, and transparency can be customized.
📈Chart
The chart below shows an example of three Bollinger Bands tools: Bollinger Band, %B and Bandwidth are in display.
To do this, you need to add this indicator TWICE where you select %B from Option in the first addition of this indicator and Bandwidth from Option in the second addition.
🟦 Usage:
🟠Monitor Volatility:
Watch Bandwidth values to spot volatility contractions (Squeeze) and expansions (Bulge) that often precede strong price moves.
John Bollinger defines Squeeze and Bulge as follows;
Squeeze:
The lowest bandwidth in the past 125 period, where trend is born.
Bulge:
The highest bandwidth in the past 125 period where trend is going to die.
According to John Bollinger, this 125 period can be used in any timeframe.
📈Chart1
Example of Squeeze
You can see uptrends start after squeeze(red triangles)
📈Chart2
Example of Bulge
You can see the trend reversal from downtrend to uptrends at the bulge(green triangles)
📈Chart3
Bulge DOES NOT NECESSARILY mean the beginning of a trend in opposite direction.
For example, you can see a bulge happening in the right side of the chart where green triangles are marked. Nevertheless, uptrend still continues after the bulge.
In this case, the bulge marks the beginning of a consolidation which lead to the continuation of the trend. It means that a phase of the trend highlighted in the light blue box came to an end.
Note: light blue box is not drawn by the indicator.
Like other technical analysis methods or tools, these setups do not guarantee birth of new trends and trend reversals. Traders should be carefully observing these setups along with other factors for making decisions.
🟠Track Price Position:
Use %B to see where price is located in relation to the Bollinger Bands.
If %B is close to 1, the price is near upper band while %B is close to 0, the price is near lower band.
🟠Set Alerts:
Receive alerts when Bandwidth hits highest and lowest values of bandwidth, helping you prepare for potential breakout, ending of trends and trend reversal opportunities.
🟠Combine with Other Tools:
This indicator would work best when combined with price action, trend analysis, or
market environmental analysis.
—————————————————————————————
このインジケーターはボリンジャーバンドの考案者であるジョン・ボリンジャー氏が提唱するボリンジャーバンドの使い方を再現するために、ボリンジャーバンド、%B、バンドウィズ(Bandwidth) の3つを1つのインジケーターで表示可能にしたものです。シグナルやアラートにも対応しています。
ボリンジャーバンドは1980年代にアメリカ人トレーダー兼アナリストのジョン・ボリンジャー氏によって開発されました。彼はその30年後に%Bとバンドウィズを導入しました。
🟦 他のボリンジャーバンドとの違い
TradingView標準のボリンジャーバンドや他のボリンジャーバンドとは異なり、このインジケーターでは3つのボリンジャーバンドツールを1つのインジケーターで表示し、シグナルやアラート機能も利用できるようになっています。
一般的に知られている通常のボリンジャーバンドに加え、%Bやバンドウィズを組み合わせて表示でき、設定次第では3つすべてを同時にモニターすることも可能です。これにより、価格とボリンジャーバンドの位置関係とボラティリティ変化をひと目で、かつ定量的に把握することができます。
🟦 機能:
ボリンジャーバンド(アッパーバンド・基準線・ロワーバンド)を描画し、バンド間を塗りつぶし表示。
オプションで%Bまたはバンドウィズを追加表示可能。
バンドウィズの最高値・最安値を、任意の期間で検出して表示。
バンドウィズが指定期間の最高値(バルジ※)または最安値(スクイーズ)に達した際にシグナルを表示。
※バルジは一般的にボリンジャーバンドで用いられるエクスパンションとほぼ同じ意味ですが、定義が異なります。(下記参照)
バルジおよびスクイーズ発生時のアラート設定が可能。
📈 チャート例
下記チャートの緑の三角と赤の三角は、それぞれバルジとスクイーズを示しています。
🟦 設定:
Length: ボリンジャーバンドの基準線計算に使う期間。
Basis MA Type: SMA, EMA, SMMA (RMA), WMA, VWMAから選択可能。
StdDev: 標準偏差の乗数(デフォルト2.0)。
Option: 「Bandwidth」または「%B」を選択(両方表示するにはこのインジケーターを2回追加)。
Period for Squeeze and Bulge: Bandwidthの最高値・最安値を検出する期間(デフォルトはジョン・ボリンジャー氏が推奨する125)。
Style Settings: 色、線の太さ、透明度などをカスタマイズ可能。
📈 チャート例
下のチャートは「ボリンジャーバンド」「%B」「バンドウィズ」の3つを同時に表示した例です。
この場合、インジケーターを2回追加し、最初に追加した方ではOptionを「%B」に、次に追加した方では「Bandwidth」を選択します。
🟦 使い方:
🟠 ボラティリティを監視する:
バンドウィズの値を見ることで、価格変動の収縮(スクイーズ)や拡大(バルジ)を確認できます。
これらはしばしば強い値動きの前兆となります。
ジョン・ボリンジャー氏はスクイーズとバルジを次のように定義しています:
スクイーズ: 過去125期間の中で最も低いバンドウィズ→ 新しいトレンドが生まれる場所。
バルジ: 過去125期間の中で最も高いバンドウィズ → トレンドが終わりを迎える場所。
この「125期間」はどのタイムフレームでも利用可能とされています。
📈 チャート1
スクイーズの例
赤い三角のスクイーズの後に上昇トレンドが始まっているのが確認できます。
📈 チャート2
バルジの例
緑の三角のバルジの箇所で下降トレンドから上昇トレンドへの反転が見られます。
📈 チャート3
バルジが必ずしも反転を意味しない例
下記のチャート右側の緑の三角で示されたバルジの後も、上昇トレンドが継続しています。
この場合、バルジは反転ではなく「トレンド一時的な調整(レンジ入り)」を示しており、結果的に上昇トレンドが継続しています。
この場合、バルジは水色のボックスで示されたトレンドのフェーズの終わりを示しています。
※水色のボックスはインジケーターが描画したものではありません。
また、他のテクニカル分析と同様に、これらのセットアップは必ず新しいトレンドの発生やトレンド転換を保証するものではありません。トレーダーは他の要素も考慮し、慎重に意思決定する必要があります。
🟠 価格とボリンジャーバンドの位置関係を確認する:
%Bを利用すれば、価格がバンドのどこに位置しているかを簡単に把握できます。
%Bが1に近ければ価格はアッパーバンド付近、0に近ければロワーバンド付近にあります。
🟠 アラートを設定する:
バンドウィズが一定期間の最高値または最安値に到達した際にアラートを設定することで、ブレイクアウトやトレンド終了、反転の可能性に備えることができます。
🟠 他のツールと組み合わせる:
このインジケーターは、プライスアクション、トレンド分析、環境認識などと組み合わせて活用すると最も効果的です。

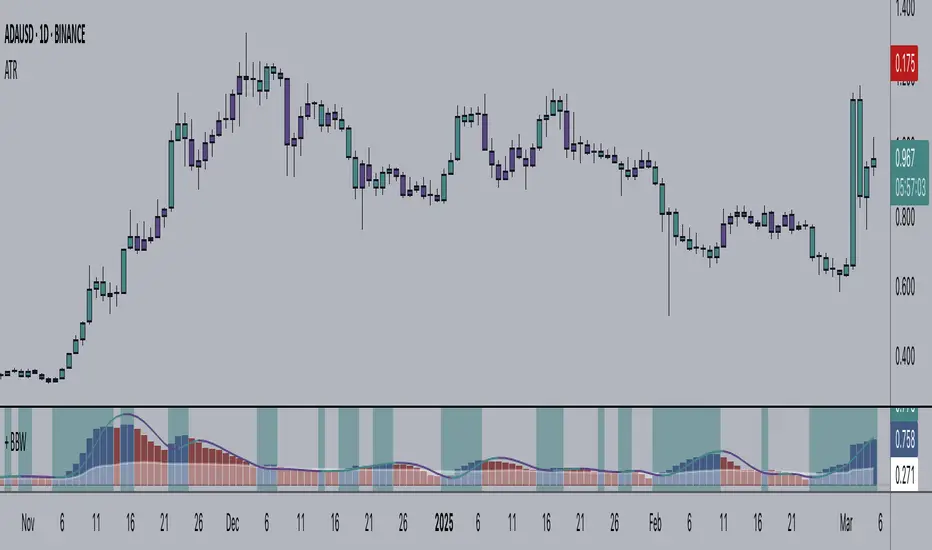
Bollinger BandWidth Squeeze BreakoutBollinger BandWidth Squeeze Breakout
Description:
This indicator merges classic Bollinger BandWidth (BBW) with TTM Squeeze Pro-style compression dots. It identifies volatility contractions, very effective at identifying chop or ranging markets, and color-codes the BBW line based on directional breakout bias—helping traders anticipate explosive moves before they happen.
It supports multi-level squeeze detection:
High Compression (Orange) : Tightest squeeze — highly coiled setup
Medium Compression (Red) : Moderate squeeze — building pressure
Low Compression (Black) : Light squeeze — early contraction
(No dot means no squeeze – free expansion)
How It Works
Bollinger BandWidth (BBW):
Calculated as the percent width between Bollinger Bands over a selected moving average (SMA, EMA, etc.). A rising BBW suggests volatility expansion; falling BBW indicates compression.
Directional Bias (BBW Color):
The line is colored green when recent bars show upside breakout pressure, red when downside pressure dominates, and gray when neutral. This is based on cumulative position of price relative to the Bollinger Bands.
TTM Squeeze Pro Dots:
Compression dots plotted on the zero line represent volatility squeeze levels, using up to 3 Keltner Channel thresholds:
Orange Dot : High compression (tightest squeeze zone)
Red Dot : Medium compression
Black Dot : Low compression
(No dot means no squeeze — price is expanding)
Expansion & Contraction Context:
Plots historical highest/lowest BBW values (user-defined period) to help spot extreme conditions.
How to Interpret:
Use squeeze dots to identify when the market is “chop/ranging.” Breakouts from these zones often come with sharp moves.
BBW Line Color = Bias Filter:
Green → Bullish expansion pressure
Red → Bearish expansion pressure
Gray → Neutral or undecided
Use this to filter direction before entering a breakout or momentum trade.
Inputs:
Length : Period for BB and Keltner calculations
MA Type : Choose from SMA, EMA, SMMA, WMA, VWMA, or None
StdDev : Standard deviation for BB
Expansion/Contraction Lengths : Historical window to track BBW extremes
Source : Input source for all calculations (default: Close)
Keltner Multipliers : Customize thresholds for high/mid/low compression
Best For:
Traders looking to anticipate breakout direction
Scalpers and swing traders seeking early volatility cues
Anyone using BB or TTM Squeeze logic in their setups
Pro Tips:
Combine with momentum tools (e.g., RSI, MACD, SMI, CCI) to confirm breakout thrust
Use squeeze dot color shifts (red/orange → no dot) as a breakout timing tool
Use historical BBW highs/lows as context for relative volatility expansion

Bollinger Bands ETSOverview
Bollinger Bands ETstyle (BB ETS) is an advanced volatility and breakout detection indicator, building upon the classic Bollinger Bands. This script introduces adaptive ATR-based band width smoothing and clear squeeze detection, making it a versatile tool for traders seeking more responsive and actionable volatility analysis.
Features
Dual Bollinger Bands: Plots both standard and outer bands around a configurable moving average, allowing visualization of typical and extreme volatility ranges.
ATR-Based Band Smoothing (Optional): When enabled, the bands automatically widen during low-volatility periods using the Average True Range (ATR), reducing false signals and making the bands more adaptive.
Squeeze Detection (Optional): Highlights periods when the bands contract below a user-defined threshold, signaling potential breakout setups. Squeeze periods are visually marked with a background highlight for easy identification.
Customizable Settings: Users can adjust band length, standard deviation multipliers, ATR parameters, and squeeze thresholds. Both ATR smoothing and squeeze detection can be toggled on or off.
Clean Chart Output: The indicator overlays directly on price with clear, distinguishable visuals for all features.
How It Works
The indicator calculates a moving average (basis) and plots upper and lower bands at user-selected standard deviations.
If ATR smoothing is enabled, the band width expands by a multiple of the ATR, adapting to real-time volatility.
The script computes the relative band width ("bandwidth"). When this falls below your chosen threshold, the background is highlighted to indicate a "squeeze"-a period of reduced volatility that often precedes breakouts.
How to Use
Trend & Volatility Analysis: Use the bands to identify overbought/oversold conditions and current market volatility. Price touching or crossing the outer bands may signal trend exhaustion or continuation.
Breakout Anticipation: Watch for background highlights indicating a squeeze. These periods suggest the market is coiling for a potential significant move.
Adaptive Sensitivity: Enable ATR smoothing to keep bands relevant during both calm and volatile markets, reducing false signals in low-volatility conditions.
Customization: Adjust all parameters in the settings to match your trading style and the asset’s behavior.
Limitations
The indicator is designed for standard price charts and may not perform as intended on non-standard chart types (such as Renko or Heikin Ashi).
As with all technical tools, best results are achieved when used alongside other forms of analysis.
Summary
Bollinger Bands ETstyle (BB ETS) offers a modern, adaptive approach to volatility and breakout analysis by combining classic bands with ATR-based smoothing and clear squeeze visualization. It is suitable for trend-following and breakout strategies, and requires no additional scripts-simply apply to your chart and adjust the settings as needed.

Bollinger Bands MTF & Kalman Filter | Flux Charts📈 Multi-Timeframe Kalman Filtered Bollinger Bands Indicator
Introducing our MTF Kalman Filtered Bollinger Bands – a powerful multi-timeframe Bollinger Bands (BB) indicator enhanced with Kalman filtering for superior smoothing and trend analysis. This indicator dynamically adapts Bollinger Bands across multiple timeframes while incorporating volume-based gradient transparency to highlight significant price movements. This indicator is better optimized for lower timeframes.
❓ How to Interpret the Bands & Volume Gradient:
Our indicator combines Lower Timeframe (LTF) and Higher Timeframe (HTF) Bollinger Bands to provide a comprehensive trend analysis. It applies Kalman filtering to the LTF bands, ensuring smoother, noise-reduced signals. The color gradient and relative volume-based transparency offer deeper insights into price strength.
🔹 LTF Bollinger Bands: Shorter-period bands filtered with a Kalman smoothing algorithm, reducing lag and noise.
🔹 HTF Bollinger Bands: Traditional Bollinger Bands plotted on a higher timeframe, offering macro trend analysis.
🔹 Volume Gradient Transparency: The bands adjust their opacity based on relative buy/sell volume, allowing traders to assess momentum strength.
📌 How Does It Work?
1️⃣ Multi-Timeframe Bollinger Bands Calculation
The LTF BB uses Kalman filtering for a smoother price representation, helping to reduce false signals.
The HTF BB is EMA-smoothed for improved trend clarity.
2️⃣ Adaptive Gradient Transparency
The opacity of the fill color between the bands is determined by relative buy/sell volume.
Higher buy volume = stronger bullish signal (greener bands).
Higher sell volume = stronger bearish signal (redder bands).
3️⃣ Dynamic Trend Signals & Breakouts
Buy Signal: When price breaks below the HTF lower band and LTF bands start rising.
Sell Signal: When price breaks above the HTF upper band and LTF bands start falling.
⚙️ Settings & Customization:
🛠 LTF and HTF Bollinger Bands Settings:
Multiplier: The multiplier applied to the BB to determine the upper and lower bands
Length: Define the number of bars determines the BB calculations.
Custom Timeframe Selection: Choose from predefined options (e.g., 5m, 15m, 1H, 4H, etc).
🎨 Gradient & Transparency Settings:
Bullish/Bearish Color Options: Customize colors for uptrend and downtrend conditions.
Max & Min Opacity: Adjust the transparency levels based on volume intensity.
Solid vs. Gradient Mode: Choose between a gradient fill or a solid color mode for clarity.
📌 Recommended Settings for Optimal Use:
1️⃣ Timeframe Selection (LTF -> HTF):
1 min -> 5 min
2 min -> 5 min
3 min -> 15 min
5 min -> 15 min
15 min -> 1 hr
1 hr -> 4 hr
4 hr -> 1 day
2️⃣ Multiplier: Use 2.0 for LTF and 2.25 for HTF
3️⃣Length: Use a length of 20 - 30 bars
🚀 Why Use This Indicator?
✅ Multi-Timeframe Bollinger Bands with Kalman Filtering – Ideal for traders looking for reduced lag and clearer trend signals.
✅ Volume-Based Transparency – See momentum shifts instantly with adaptive opacity.
✅ Dynamic Buy & Sell Signals – Alerts based on price action + volume trends.
✅ Customizable for Any Strategy – Adjust colors, timeframes, and filtering options for personalized trading.

Rectified BB% for option tradingThis indicator shows the bollinger bands against the price all expressed in percentage of the mean BB value. With one sight you can see the amplitude of BB and the variation of the price, evaluate a reenter of the price in the BB.
The relative price is visualized as a candle with open/high/low/close value exspressed as percentage deviation from the BB mean
The indicator include a modified RSI, remapped from 0/100 to -100/100.
You can choose the BB parameters (length, standard deviation multiplier) and the RSI parameter (length, overbougth threshold, ovrsold threshold)
You can exclude/include the candles and the RSI line.
The indicator can be used to sell options when the volatility is high (the bollinger band is wide) and the price is reentering inside the bands.
If the price is forming a supply or demand area it can be a good opportunity to sell a bull put or a bear call
The RSI can be used as confirm of the supply/demand formation
If the bollinger band is narrow and the RSI is overbought/oversold it indicate a better opportunity to buy options
the indicator is designed to work with daily timeframe and default parameters.

Greedy DCA█ OVERVIEW
Detect price crashes in volatile conditions. This is an indicator for a greedy dollar cost average (DCA) strategy. That is, for people who want to repeatedly buy an asset over time when its price is crashing.
█ CONCEPTS
Price crashes are indicated if the price falls below one or more of the 4 lower Bollinger Bands which are calculated with increasing multipliers for the standard deviation.
In these conditions, the price is far below the average. Therefore they are considered good buying opportunities.
No buy signals are emitted if the Bollinger Bands are tight, i.e. if the bandwidth (upper -lower band) is below the value of the moving average multiplied with a threshold factor. This ensures that signals are only emitted if the conditions are highly volatile.
The Bollinger Bands are calculated based on the daily candles, irrespective the chart time frame. This allows to check the strategy on lower time frames

custom Bollinger bands with filters - indicator (AS)-----------Description-------------
This indicator is basically Bollinger bands with many ways to customize. It uses highest and lowest values of upper and lower band for exits. I think something is wrong with the script but cant find any mistakes – most probably smoothing. The ATR filter is implemented but is working incorrectly. In code you can also turn it into strategy but I do not recommend it for now as it is not ready yet.
So this is my first script and I am looking for any advice, ideas to improve this script, sets of parameters, markets to apply, logical mistakes in code or any ideas that you may have. Indicator was initially designed for EURUSD 5MIN but I would be interested in other ideas.
-----------SETTINGS--------------
---START - In starting settings we can choose
Line 1: what parts to use BB/DC/ATR
Line 2: what parts to plot on chart
Line 3 Whether or not apply smoothing to BB or ATR filter
Line 4 Calculate deviation for BB from price or Moving average
Line 5 Fill colors and plot other parts for debug (overlay=false)
Line 6:( for strategy) – enable Long/Short Trades
---BB and DC – here we modify Bollinger bands and Donchian
Line 1: Length and type of BB middle line and also length of DC from BB
Line 2: Length and type of BB standard deviation and multiplier
Line 3: Length and type of BB smoothing and %width for BB filter
---ATR filter – (not ready fully yet)
Line 1: type and length of ATR
Line 2: threshold and smoothing value of ATR
---DATE and SESSION
Line 1: apply custom date or session?
Line 2: session hours settings
Line 3:Custom starting date
Line 4: Custom Ending date
-----------HOW TO USE--------------
We open Long if BB width is bigger than threshold and close when upper band is no longer highest in the period set. Exact opposite with Short

FibonRSI / ErkOziHello,
This software is a technical analysis script written in the TradingView Pine language. The script creates a trading indicator based on Fibonacci retracement levels and the RSI indicator, providing information about price movements and asset volatility by using Bollinger Bands.
There are many different scripts in the market that draw RSI and Fibonacci retracement levels. However, this script was originally designed by me and shared publicly on TradingView.
***The indicator uses RSI (Relative Strength Index) and Bollinger Bands (BB) as the basis for the FibonRSI strategy. RSI measures the strength of a price movement, and BB measures the volatility of an asset. The FibonRSI strategy is based on the idea that the Fibonacci ratios and RSI can be used to predict a asset's price retracement levels.
***The script allows for various parameters to be adjusted. Users can specify the price source type and adjust the periods for RSI and Bollinger Bands. The standard deviation number for Bollinger Bands can also be customized.
***The script calculates the current RSI indicator position and the basic, upper, and lower levels of Bollinger Bands. It then calculates and draws the Fibonacci retracement levels. The color of the RSI line is determined by the upper and lower distribution levels of Bollinger Bands. Additionally, the color of the Fibonacci retracement levels can also be customized by the user.
***This script can be used to determine potential buy and sell signals using Fibonacci retracement levels and RSI. For example, when the RSI is oversold and the price is close to a Fibonacci retracement level, it can be interpreted as a buying opportunity. Similarly, when the RSI is overbought and the price is close to a Fibonacci retracement level, it can be interpreted as a selling opportunity.
***The script takes input parameters such as the price source used for calculation, the period for the RSI indicator, the period for the Moving Average in Bollinger Bands, and the number of standard deviations used in Bollinger Bands.
***The script's conditions include elements such as calculating the current position of the RSI indicator, calculating the upper and lower Bollinger Bands, calculating the dispersion factor, and calculating Fibonacci levels.
***The parameters in the code can be adjusted for calculation, including the price type used, the RSI period, the Moving Average period for BB, and the standard deviation count for BB. After this, the current position of the RSI, Moving Average, and standard deviation for BB are calculated. After calculating the upper and lower BB, the levels above and below the average are calculated using a specific dispersion constant.
CONDITIONS FOR THE SCRIPT
current_rsi = ta.rsi(src, for_rsi) // Current position of the RSI indicator
basis = ta.ema(current_rsi, for_ma)
dev = for_mult * ta.stdev(current_rsi, for_ma)
upper = basis + dev
lower = basis - dev
dispersion = 1
disp_up = basis + (upper - lower) * dispersion
disp_down = basis - (upper - lower) * dispersion
// Fibonacci Levels
f100 = basis + (upper - lower) * 1.0
f78 = basis + (upper - lower) * 0.78
f65 = basis + (upper - lower) * 0.65
f50 = basis
f35 = basis - (upper - lower) * 0.65
f23 = basis - (upper - lower) * 0.78
f0 = basis - (upper - lower) * 1.0
***When calculating Fibonacci levels, the distance between the average of BB and the upper and lower BB is used. These levels are 0%, 23.6%, 35%, 50%, 65%, 78.6%, and 100%. Finally, the RSI line that changes color according to a specific RSI position, Fibonacci levels, and BB are visualized. Additionally, the levels of 70, 30, and 50 are also shown.
The script then sets the color of the RSI position according to the EMA and draws Bollinger Bands, RSI, Fibonacci levels, and the 70, 30, and 50 levels.
In conclusion, this script enables traders to analyze market trends and make informed decisions. It can also be customized to suit individual trading strategies.
This script analyzes the RSI indicator using Bollinger Bands and Fibonacci levels. The default settings are 14 periods for RSI, 233 periods and 2 standard deviations for BB. The MA period inside BB is selected as the BB period and is used when calculating Fibonacci levels.
***The reason for selecting these settings is to provide enough time for BB period to confirm a possible trend. Additionally, the MA period inside BB is matched with the BB period and used when calculating Fibonacci levels.
***Fibonacci levels are calculated from the distance between the upper and lower bands of BB and show how RSI movement is related to these levels. Better results can be achieved when RSI periods are set to Fibonacci numbers such as 21, 55, and 89. Therefore, the use of Fibonacci numbers is recommended when adjusting RSI periods. Fibonacci numbers are among the technical analysis tools that can capture the reflection of naturally occurring movements in the market. Therefore, the use of Fibonacci numbers often helps to better track fluctuations in the market.
Finally, the indicator also displays the 70 and 30 levels and the middle level (50) with Fibonacci levels drawn in circles. Changing these settings can help optimize the Fibonacci levels and further improve the indicator.
Thank you in advance for your suggestions and opinions......

Bollinger Bands %B (ValueRay)One of the key features of this BB%B is its ability to highlight overbought and oversold conditions. This allows you to make informed decisions on when to enter and exit a trade, helping you maximize your profits and minimize your losses.
- Bollinger Bands %B with the ability to change to a different Time Frame.(Defaults to current Chart Time Frame).
- Ability To Turn On/Off Background Highlighting if BB %B is Above/Below 0 / 1 thresholds.
- Ability To Turn On/Off Background Highlighting when BB %B Crosses back above/unser 0/1 thresholds.
---
My personal recommandation use: combine with CM_Ultimate RSI Multi Time Frame (ChrisMoody) and have solid oversold/overbought levels, when hes RSI and my BB %B are bot red/green

+ Bollinger Bands WidthHere is my rendition of Bollinger Bands Width. If you are unfamiliar, Bollinger Bands Width is a measure of the distance between the top and bottom bands of Bollinger Bands. Bollinger Bands themselves being a measure of market volatility, BB Width is a simpler, cleaner way of determining the amount of volatility in the market. Myself, I found the original, basic version of BB Width a bit too basic, and I thought that by adding to it it might make for an improvement for traders over the original.
Simple things that I've done are adding a signal line; adding a 'baseline' using Donchian Channels (such as that which is in my Average Candle Bodies Range indicator); adding bar and background coloring; and adding alerts for increasing volatility, and baseline and signal line crosses. It really ends up making for a much improved version of the basic indicator.
A note on how I created the baseline:
First, what do I mean by 'baseline?' I think of it as an area of the indicator where if the BB Width is below you will not want to enter into any trades, and if the BB Width is above then you are free to enter trades based on your system. It's basically a volatility measure of the volatility indicator. Waddah Attar Explosion is a popular indicator that implements something similar. The baseline is calculated thus: make a Donchian Channel of the BB Width, and then use the basis as the baseline while not plotting the actual highs and lows of the Donchian Channel. Now, the basis of a Donchian Channel is the average of the highs and the lows. If we did that here we would have a baseline much too high, however, by making the basis adjustable with a divisor input it no longer must be plotted in the center of the channel, but may be moved much lower (unless you set the divisor to 2, but you wouldn't do that). This divisor is essentially a sensitivity adjustment for the indicator. Of course you don't have to use the baseline. You could ignore it and only use the signal line, or just use the rising and falling of the BB Width by itself as your volatility measure.
I should make note: the main image above at default settings is an 8 period lookback (so, yes, that is quite fast), and the signal line is a Hull MA set to 13. The background and bar coloring are simply set to the rising and falling of the BB Width. Images below will show some different settings, but definitely play with it yourself to determine if it might be a good fit for your system.
Above, settings are background and bar coloring tuned to BB Width being above the baseline, and also requiring that the BB Width be rising. Background coloring only highlights increasing volatility or volatility above a certain threshold. Grey candles are because the BB Width is above the baseline but falling. We'll see an example without the requirement of BB Width rising, below.
Here, we see that background highlights and aqua candles are more prevalent because I've checked off the requirement that BB Width be rising. The idea is that BB Width is above the baseline therefor there is sufficient volatility to enter trades if our indicators give us the go-ahead.
This here is set to BB Width being above the signal line and also requiring a rising BB Width. Keep in mind the signal line is a Hull MA.
And this fourth and final image uses a volume-weighted MA as the signal line. Bar coloring is turned off, and instead the checkboxes for volatility advancing and declining are turned on under the signal line options. BB Width crosses up the signal line is advancing volatility, while falling below it is declining volatility. Background highlights are set to baseline and not requiring a rising BB Width. This way, with a quick glance you can see if the rising volatility is legitimate, i.e., is the cross up of the signal line coupled with it being above the baseline.
Please enjoy.
Bollinger Bands SignalsDescription:
This indicator works well in trendy markets on long runs and in mean-reverting markets, at almost any timeframe.
That said, higher timeframes are much preferred for their intrinsic ability to cut out noise. The example chart is in 3H TF.
Be mindful, the script shows somewhat erratic jigsaw-like behaviour during consolidation periods when the price
jumps up and down in indecision which way to go. Fortunately, there are scripts out there that detect such periods.
You can choose between 4 Moving Averages, Vidya being the default. Period, Deviation and Bands Width parameters
all of them affect the signal generation.
For the Pine Script coder this script is pretty obvious.
It uses a standard technical analysis indicator - Bollinger Bands - and appends it with a 'width' parameter and
a signal generation procedure.
The signal generation procedure is the heart of this script that keeps the script pumping signals.
The BB width is used as a filter.
You can use this procedure in your own scripts and it will continue generate signals according to your rules.

Wavetrend in Dynamic Zones with Kumo Implied VolatilityI was asked to do one of those, so here we go...
As always free and open source as it should be. Do not pay for such indicators!
A WaveTrend Indicator or also widely known as "Market Cipher" is an Indicator that is based on Moving Averages, therefore its an "lagging indicator". Lagging indicators are best used in combination with leading indicators. In this script the "leading indicator" component are Daily, Weekly or Monthly Pivots . These Pivots can be used as dynamic Support and Resistance , Stoploss, Take Profit etc.
This indicator combination is best used in larger timeframes. For lower timeframes you might need to change settings to your liking.
The general Wavetrend settings are the same that are used in Market Cipher, Market Liberator and such popular indicators.
What are these circles?
-These are the WaveTrend Divergences. Red for Regular-Bearish. Orange for Hidden-Bearish. Green for Regular-Bullish. Aqua for Hidden-Bullish.
What are these white, orange and aqua triangles?
-These are the WaveTrend Pivots. A Pivot counter was added. Every time a pivot is lower than the previous one, an orange triangle is printed, every time a pivot is higher than the previous one an aqua triangle is printed. That mimics a very common way Wavetrend is being used for trading when using those other paid Wavetrend indicators.
What are these Orange and Aqua Zones?
-These are Dynamic Zones based on the indicator itself, they offer more information than static zones. Of course static lines are also included and can be adjusted.
What are the lines between the waves?
-This is a Kumo Cloud Implied Volatility indicator. It is color coded and can be used to indicate if a major market move/bottom/top happened.
What are those numbers on the right?
-The first number is a Bollinger Band indicator that shows if said Bollinger Band is in a state of Oversold/Overbought, the second number is the actual Bollinger Band Width that indicates if the Bollinger Band squeezes, normally that happens right before the market makes an explosive move.
Please keep in mind that this indicator is a tool and not a strategy, do not blindly trade signals, do your own research first! Use this indicator in conjunction with other indicators to get multiple confirmations.

Generalized Bollinger Bands %B And Bandwidth (Tartigradia)Bollinger Band is simply a representation of the rolling average of price and its standard deviation around the average (called the "basis").
This indicator generalizes the Bollinger Band by implementing many different equations to calculate the Bollinger Bands beyond the standard deviation and sma, and then plot the %B (where the current price falls inside the Bollinger Band), Bandwidth (size of the Bollinger Band) as well as the Bollinger Band itself and a reproduction of the OHLC price candles in a separate pane.
Whereas other Bollinger Bands indicators often just change the basis but not the stdev calculation, the correct way to change the basis is to also change it inside the stdev calculation.
Advanced features such as temporal discounting (ie, newer bars can have more weights), median absolute deviation and multiple sigma bands (eg, 3-sigma) are available.
Up to 3 different Bollinger Bands can be displayed, and the background can be highlighted when price is overbought/oversold (beyond the Bollinger Band of choice). Tip: BB3, which is the bollinger band with standard deviation of 3, which represents 99% of observed values in the lookback period, is a good choice to highlight overbought/oversold conditions.
Three "Sentiment Bars" are provided to see at a glance the sentiments on the price action relative to the Bollinger Bands as reflected by the %B value.
Usage:
Use the %B as a measure of sentiment: bullish if > 0.5, bearish if < 0.5. You can use the Sentiment Bars at the bottom for a quick reference: aqua if bullish, red if bearish, gray if undefined (too close to the middle line).
Use the bandwidth as a measure of volatility: higher is more volatile, lower is less.
When overbought, it can be a good time to sell/short. Use a higher Bollinger Band Multiplier such as 3 or more to reduce false positives.
When oversold, it can be a good time to buy/long. Use a higher Bollinger Band Multiplier such as 3 or more to reduce false positives.
Consider setting a much tighter lookback period of 4 as recommended in backtested works (en.wikipedia.org), use zlma instead of sma, and finally set a higher timeframe for the Bollinger Bands than the one you are currently studying. Then, the Bollinger Bands can help in detecting overbought and oversold regions (price going "out of bands").
Note that I tried to automate the setting of a higher timeframe, but for some reason the output is different when I manually do it using request.security() than when it's in indicator(timeframe=""). If someone has any suggestion as to why it happens, please let me know! (You can try it for yourself by uncommenting the auto_timeframe parameter line).

Bollinger Bands Width and Bollinger Bands %BThis script shows both the Bollinger Band Width(BBW) and %B on the same indicator window.
Both the BBW and %B are introduced by John Bollinger(creator of Bollinger Bands) in 2010.
Default Parameter values: Length = 20, Source = Close, Mult = 2
Bollinger Bands Width (BBW): Color = (Default: Green )
- I consider stocks with "BBW >= 4" are at a volatile state and ready for price contraction, but this depends on the parameter values of your choice.
Bollinger Bands %B (%B): Color = (Default: Blue )
1. %B Above 10 = Price is Above the Upper Band
2. %B Equal to 10 = Price is at the Upper Band
3. %B Above 5 = Price is Above the Middle Line
4. %B Below 5 = Price is Below the Middle Line
5. %B Equal to 0 = Price is at the Lower Band
6. %B Below 0 = Price is Below the Lower Band

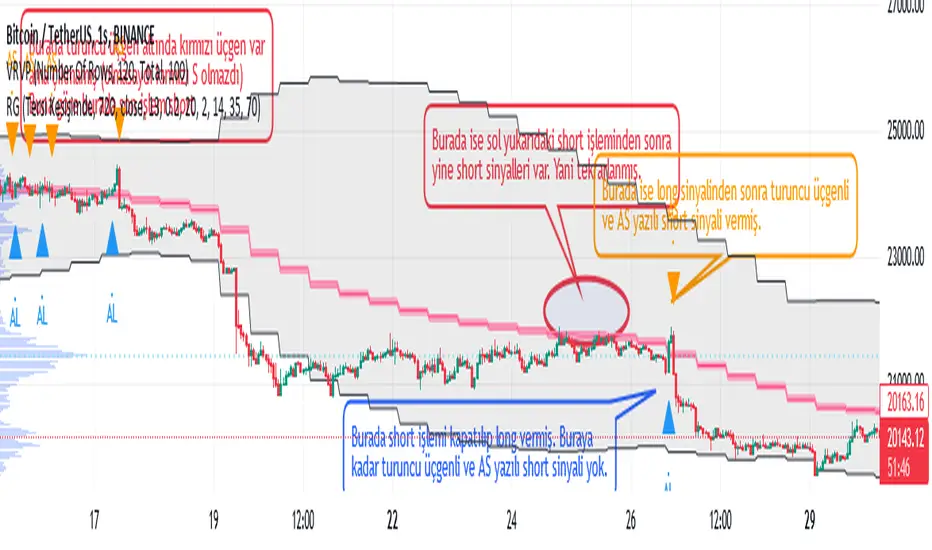
Weather Vane
Why is the indicator called 'wind Vane'? Because in this indicator, the trade is entered according to which side the price cuts the EMA that you will determine.
For example, if we have chosen EMA_X as 13, if the price cuts ema13 up within the tolerance you specify, it enters the LONG transaction, if it cuts down, it enters the SHORT transaction and closes the opposite direction while entering a transaction. In other words, the 'wind rose' as the price moves towards that direction (it is blown according to the wind) :)
Explanation on "Açık Pozisyonun Çıkış Koşullarını Seçin": If "Tersi Kesişimde" option is selected, the closing of the open trade is only possible when the price cuts the EMA_X+-tolerance value in the opposite direction. For example, if the price has cut the EMA_X+tolerance up and LONG has been entered in the transaction, this LONG transaction will be closed only by cutting the EMA_X-tolerance back down and entering the SHORT transaction.
If the "BB Sınırında" option is selected, the closing of the open trade is when the price reaches the Bollinger Band limit. For example, if the last price cut the EMA_X+tolerance up and a LONG trade was opened, this trade will be closed if the price comes from below and reaches the upper limit of the Bollinger Band. SHORT The transaction is closed when the price comes from above and reaches the lower limit of the Bollinger Band (black diamond appears as a figure).
If the "OB ve OS'larda" option is selected, the condition of reaching the above Bollinger Band limit for trades to be closed, plus the fact that the RSI exceeds the OverSold (base limit) and OverBought (ceiling limit) values specified in the settings tab of the indicator. (Visible as a navy blue diamond shape)
EMA, Bollinger Band and RSI values in the conditions of entering a LONG or SHORT trade or closing the trade, whatever it is, are calculated according to the candle duration to be selected from here, independently of the candle duration selected on the chart, and printed on the chart, and the trades are realized at the values of this selected candle period.
The default state is based on 720-minute, 12h (12-hour) candles. In this default state, even if you select the candle duration of 1 hour from the chart, whether the trading conditions are met or not is checked according to the RSI EMA_X and BBand values in 720 minutes.
When "any alert condition" is selected while setting an alarm, a single alarm will be set on all alarm conditions and it will notify (by specifying which condition) which alarm condition is met. However, when setting the alarm, it reports once in each candle according to the candle duration selected on the chart. For example, let's say that we have chosen the candle duration of 5 minutes on the chart, and we have chosen the TFM as 720 minutes, that is, 12h. In this case, even if any condition is met multiple times within 5 minutes, it only tells us the first one. If the condition is still met at the opening of the new candle, it will report once in the new candle, and now, even if the condition is met again a hundred times in the last candle, it will only report the first one. If the opposite condition is met within 5 minutes and the last trade entered by moving long steps, the price will be closed and the entry to the opposite direction may be delayed, you can select the candle duration of 1 minute from the chart.
In the meantime, it can give LONG notifications over and over while already in LONG position, but since the balance is fully processed in the first, subsequent LONG notifications do not matter. Likewise SHORT and pose exit notifications.
Bollinger Bands Breakout Oscillator [LuxAlgo]The Bollinger Bands Breakout Oscillator is an oscillator returning two series quantifying the significance of breakouts between the price and the extremities of the Bollinger Bands indicator.
Settings
Length: Period of the Bollinger Bands indicator
Mult: Controls the width of the Bollinger Bands
Src: Input source of the indicator
Usage
Each series is calculated by summing the distance between price and a respective Bollinger Bands extremity in the case price is outside this extremity and divided by the sum of the absolute distance between price and a respective extremity. This sum is done over the most recent Length bars.
Bullish breakouts are represented by the green areas of the indicator, while bearish breakouts are represented by the red areas of the indicator.
The oscillator can determine the presence of an uptrend when the bullish area is superior to the bearish area, while a downtrend is indicated by a bearish area being superior to the bullish one. The significance of the breakout is determined by the amplitude of each area, with higher amplitudes indicating more significant breakouts or strong trends.
Using higher Mult values would naturally return wider bands, which would induce less frequent breakouts, this would be highlighted by the oscillator.
In the chart above we can see the oscillator using a multiplicative factor of 2.

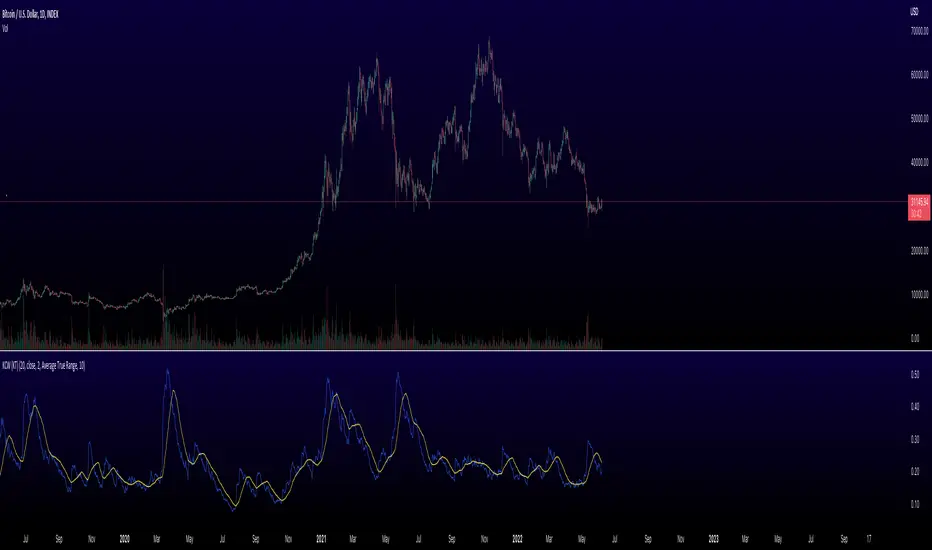
Keltner Channel Width Oscillator (KingThies)Definition
The Keltner Channel Width oscillator is a technical analysis indicator derived originally from the same relationship the Bollinger Band Width indicator takes on Bollinger Bands.
Similar to the Bollinger Bands, Kelts measure volatility in relation to price, and factor in various range calculations to create three bands around the price of a given stock or digital asset. The Middle Line is typically a 20 Day Exponential Moving Average while the upper and lower bands highlight price at different range variations around its basis. Keltner Channel Width serve as a way to quantitatively measure the width between the Upper and Lower Bands and identify opportunities for entires and exits, based on the relative range price is experiencing that day.
Calculation
Kelt Channel Width = (Upper Band - Lower Band) / Middle Band
More on Keltner Channels
Keltner channel was first described by a Chicago grain trader called Chester W. Keltner in his 1960 book How to Make Money in Commodities. Though Keltner claimed no ownership of the original idea and simply called it the ten-day moving average trading rule, his name was applied by those who heard of this concept through his books.
Similarly to the Bollinger Bands, Keltner channel is a technical analysis tool based on three parallel lines. In fact, the Keltner indicator consists of a central moving average in addition to channel lines spread above and below it. The central line represents a 10-day simple moving average of what Chester W. Keltner called typical price. The typical price is defined as the average of the high, low and close. The distance between the central line and the upper, or lower line, is equivalent to the simple moving average of the preceding 10 days' trading ranges.
One way to interpret the Keltner Channel would be to consider the price breakouts outside of the channel. A trader would track price movement and consider any close above the upper line as a strong buy signal. Equivalently, any close below the lower line would be considered a strong sell signal. The trader would follow the trend emphasized by the indicator while complementing his analysis with the use of other indicators as well. However, the breakout method only works well when the market moves from a range-bound setting to an established trend. In a trend-less configuration, the Keltner Channel is better used as an overbought/oversold indicator. Thus, as the price breaks out below the lower band, a trader waits for the next close inside the Keltner Channel and considers this price behavior as an oversold situation indicating a potential buy signal. Similarly, as the price breaks out above the upper band, the trader waits for the next close inside the Keltner Channel and considers this price action as an overbought situation indicating a potential sell signal. By waiting for the price to close within the Channel, the trader avoids getting caught in a real upside or downside breakout.
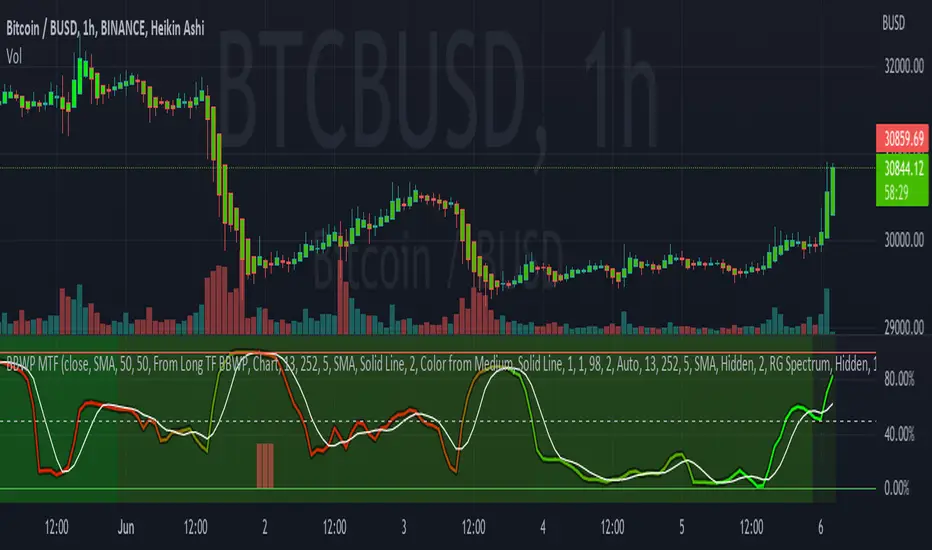
Bollinger Band Width Percentile - Multi Time FrameMy plan with this indicator was when trading at short timeframes, to modify my expectations on the potential impact of short term volatility based on volatility in longer timeframes, and when trading on longer timeframes to attempt to find an optimal entry point based on shorter term volatility.
The BBWP is calculated for a short, medium and long timeframe, alerts are triggered at extremities with the ability to filter by moving averages and chart movement. The alerts also trigger a plot to the "Backtest Signal" which can be used to trigger trades in a backtester.
Please see the discussions of how I'm using this indicator in the comments below.
Thanks to The_Caretaker for "Bollinger Band Width Percentile" upon which this multi time frame version is based.
Simple Bollinger Band Width PercentileI'm a big fan of The_Caretaker's BBWP and wanted to add it as a volatility indicator to some of my scripts, but since it is over 100 lines of code (plus spacing and comments) I wanted to find if there was a simpler way to get comparable results. SBBWP uses Pine 5 built in functions that I don't believe were available when The_Caretaker wrote BBPW. The main limitations compared to The_Caretaker's version is that it can only use SMA as its Basis Type and the colors are also not as pretty. I have not included alerts or scale lines since I'm not trying to replace BBWP, just give a simple example that you can easily build in to your scripts.
Full credit and respect to The_Caretaker!