ICT Sweep + FVG Entry (v6) • Pro Pack 📌 ICT Sweep + FVG Entry Pro Pack
This indicator combines key ICT price action concepts with practical execution tools to help traders spot high-probability setups faster and more objectively. It’s designed for scalpers and intraday traders who want to keep their chart clean but never miss critical market structure events.
🔑 Features
Liquidity Pools (HTF)
• Auto-detects recent swing highs/lows from higher timeframes (5m/15m).
• Draws both lines and optional rectangles/zones for clear liquidity areas.
Liquidity Sweeps (BSL/SSL)
• Identifies when price sweeps above/below liquidity pools and rejects back.
• Optional Grade-A sweep filter (wick size + strong re-entry).
Fair Value Gaps (FVGs)
• Highlights bullish/bearish imbalances.
• Optional midline (50%) entry for precision.
• Auto-invalidation when price fully closes inside the gap.
Killzones (New York)
• Highlights AM (9:30–11:30) and PM (14:00–15:30) killzones.
• Option to block signals outside killzones for higher strike rate.
Bias Badge (DR50)
• Displays if price is trading in a Bull, Bear, or Range context based on displacement range midpoint.
SMT Assist (NQ vs ES)
• Detects simple divergences between indices:
Bearish SMT → NQ makes HH while ES doesn’t.
Bullish SMT → NQ makes LL while ES doesn’t.
SL/TP Helper & R:R Label
• Automatically draws stop loss (at sweep extreme) and target (opposite pool or recent swing).
• Displays expected Risk:Reward ratio and blocks entries if below your chosen minimum.
Filters
• ATR filter ensures signals only appear in sufficient volatility.
• Sweep quality filter avoids weak wicks and fake-outs.
🎯 How to Use
Start on HTF (5m/15m) → Identify liquidity zones and bias.
Drop to LTF (1m) → Wait for a liquidity sweep confirmation.
Check for FVG in the sweep’s direction → Look for retest entry.
Use the SL/TP helper to validate your risk/reward before taking the trade.
Focus entries during NY Killzones for maximum effectiveness.
✅ Why this helps
This tool reduces screen time and hesitation by automating repetitive ICT concepts:
Liquidity pools, sweeps, and FVGs are marked automatically.
Killzone timing and SMT divergence are simplified.
Clear visual signals for entries with built-in RR filter help keep your trading mechanical.
⚠️ Disclaimer: This script is for educational purposes only. It does not provide financial advice or guarantee results. Always use proper risk management.
מתנדי רוחב

ICT Sweep + FVG Entry (v6) • Antoine📌 ICT Sweep + FVG Entry (Antoine)
This indicator is designed for price action traders who follow ICT concepts and want a mechanical tool to spot liquidity sweeps, fair value gaps (FVGs), and precise entry signals.
🔎 Key Features
Liquidity Pools (HTF)
• Automatically plots recent swing highs/lows from a higher timeframe (5m/15m).
• These act as Buy Side Liquidity (BSL) and Sell Side Liquidity (SSL) levels where stop orders accumulate.
Sweep Detection
• Identifies when price breaks a pool (BSL/SSL) but closes back inside → a classic liquidity grab.
• Plots a triangle on the chart when a sweep is confirmed.
Fair Value Gap (FVG) Highlighting
• Detects bullish and bearish FVGs on the execution timeframe (ideal for 1m).
• Option to display active FVG zones with shaded boxes.
Entry Signals
• A signal (cross) appears when:
A liquidity sweep occurs.
An FVG forms in the direction of the rejection.
Price retests the FVG (entry at the 50% mid-level or edge).
Alerts Ready
• Get alerted for sweeps (bullish/bearish) and for entry confirmations (long/short FVG retests).
🎯 How to Use
Choose your HTF (5m or 15m) → The indicator maps major liquidity pools.
Drop to LTF (1m) → Wait for a sweep signal at one of the pools.
Confirm with FVG → If an FVG appears in the sweep’s direction, the indicator waits for a retest.
Entry → Enter on the retest of the FVG (edge or 50%).
Risk Management
Stop loss: just beyond the sweep’s wick.
Target: opposite liquidity pool.
Minimum recommended R:R: 1:2.
✅ Why this helps
This tool makes it easier to trade ICT-style setups without missing opportunities:
No need to manually draw every swing high/low.
Automatic FVG detection saves time.
Clear sweep + FVG + retest logic keeps your entries mechanical and disciplined.
⚠️ Disclaimer: This script is for educational purposes only. It does not guarantee profits. Always use proper risk management.

SAP121212 — Close vs VWAP + Optional RSI (Signals)This indicator combines Supertrend, VWAP with bands, and an optional RSI filter to generate Buy/Sell signals.
How it works
Supertrend Flip (ATR-based): Detects when trend direction changes (from bearish to bullish, or bullish to bearish).
VWAP Band Filter: Signals only trigger if the candle close is beyond the VWAP bands:
Buy = Supertrend flips up AND close > VWAP Upper Band
Sell = Supertrend flips down AND close < VWAP Lower Band
Optional RSI Filter:
Buy requires RSI < 20
Sell requires RSI > 80
Can be enabled/disabled in settings.
Features
Choice of VWAP band calculation mode: Standard Deviation or ATR.
Adjustable ATR/StDev length and multiplier for VWAP bands.
Toggle Supertrend, VWAP lines, and Buy/Sell labels.
Alerts included: add alerts on BUY or SELL conditions (use Once Per Bar Close to avoid intrabar signals).
Use
Works best on intraday or higher timeframes where VWAP is relevant.
Use the RSI filter for more selective signals.
Can be combined with your own stop-loss and risk management rules.
⚠️ Disclaimer: This script is for educational and research purposes only. It is not financial advice. Always test thoroughly and trade at your own risk.

4 DU DINHSample Indicator Introduction (English)
Title:
Adaptive Trend & Momentum Indicator
Short Description:
An adaptive indicator that combines trend detection and momentum confirmation to help identify potential entry and exit points in various markets.
Full Description:
This indicator is designed to provide traders with a clear view of both trend direction and momentum strength. It dynamically adjusts to different market conditions, making it suitable for cryptocurrencies, stocks, and forex.
Main Features:
Trend Identification: Uses adaptive moving averages to detect bullish or bearish market phases.
Momentum Confirmation: Integrates oscillator-based signals to reduce false entries during sideways markets.
Customizable Inputs: Adjustable sensitivity, smoothing factors, and signal thresholds.
Non-repainting Logic: Signals are only confirmed after candle close to avoid misleading entries.
How to Use:
A bullish signal occurs when trend direction turns positive and momentum confirms.
A bearish signal occurs when trend direction turns negative with momentum confirmation.
Recommended for H1 and higher timeframes, but can be tuned for intraday strategies.
⚠️ Disclaimer: This indicator is for educational purposes only. It does not guarantee profits. Always combine with proper risk management and backtesting before trading live.

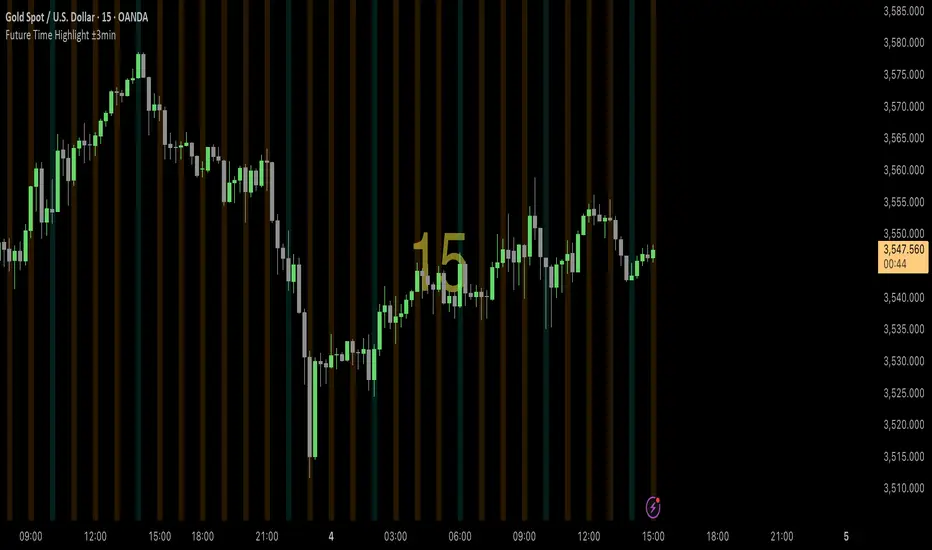
Volume gaps Volume gaps (white-highlighted zones) are unfinished business in the market. Mark them between low–high, and expect price to revisit them. They’re excellent targets for mean reversion trades and confluence levels for continuation setups
% of Average Volume% of Average Volume (RVOL)
What it is
This indicator measures cumulative volume during pre market and separately during the first 10 minutes of trading and compares it to the average 30 day volume. This matters as a high ratio of volume within the premarket and then during the first 10 minutes of trading can correlate to a stock that has a higher probability of trending in that direction throughout the day.
What it’s meant to do
Identify abnormally high or low participation early in the day.
Normalize volume by time of session, so 9:40 volume is compared to past 9:40 volume—not to the full-day total.
Provide consistent RVOL across 1–5–15–60 minute charts (the same market state yields similar readings).
Handle pre-market cleanly (optional) without inflating RVOL.
How it works (plain English)
Cumulative Intraday Volume: Adds up all bars from the session (or pre-market, if enabled) up to “now.”
Time-Matched Baseline: For each prior day in your lookback, it accumulates only up to the same intraday minute and averages those values.
RVOL %: RVOL = (Today cumulative / Average cumulative at same time) × 100.
This “like-for-like” approach prevents the classic mistakes that overstate RVOL in pre-market or make it drift with timeframe changes.
Works best on
Intraday charts: 1, 2, 3, 4, 5, 10, 15, 30, 45, 60 min
Regular & extended hours: NYSE/Nasdaq equities, futures, ETFs
Daily/weekly views are supported for reference, but the edge comes from intraday time-matched analysis.
Tip: For thin names or very early pre-market, expect more variability—lower liquidity increases noise.
Customization (Inputs → Settings)
Lookback Sessions (e.g., 20): How many prior trading days to build the average.
Include Pre-Market (on/off): If on, RVOL accumulates from pre-market start and compares to historical pre-market at the same time; if off, it begins at the regular session open only.
Session Timezone / Exchange Hours: Choose the session definition that matches your market (e.g., NYSE) so “time-matched” means the same thing every day.
Cutoff Minute (Optional): Fix a reference minute (e.g., 6:40 a.m. PT / 9:40 a.m. ET) to evaluate RVOL at a standard check-in time.
Smoothing (Optional): Apply a short moving average to the RVOL line to reduce jitter.
Thresholds & Colors: Set levels (e.g., 150%, 300%) to color the plot/labels and trigger alerts.
Show Labels/Debug: Toggle on-chart labels (current RVOL%, baseline vols) for quick audits.
On-chart visuals & alerts
RVOL% Line/Histogram: Color-coded by thresholds (e.g., >300% “exceptional”, >150% “elevated”).
Session Markers: Optional vertical lines for pre-market/regular open.
Alerts:
RVOL Crosses Above X% (e.g., 150%, 300%)
RVOL Crosses Below X%
RVOL Rising/Falling (slope-based, optional)
Good defaults to start
Lookback: 20 sessions
Pre-market: Off for large caps, On for momentum screens
Thresholds: 150% (notable), 300% (exceptional)
Smoothing: 0–3 bars (or off for fastest response)
Notes & best practices
Timeframe consistency: Because calculations are time-matched, RVOL should remain directionally consistent across intraday timeframes. If you see divergences, confirm your session hours & timezone match your instrument’s exchange.
Holiday/half days: These are included in history; you can shorten lookback or exclude such sessions if your workflow prefers.
Low-float names: Consider a slightly longer lookback to reduce outlier effects.
TL;DR
A time-matched RVOL that treats pre-market correctly, stays stable across intraday timeframes, and is fully customizable for your exchange hours, thresholds, and alerts—so you can spot real participation when it matters.

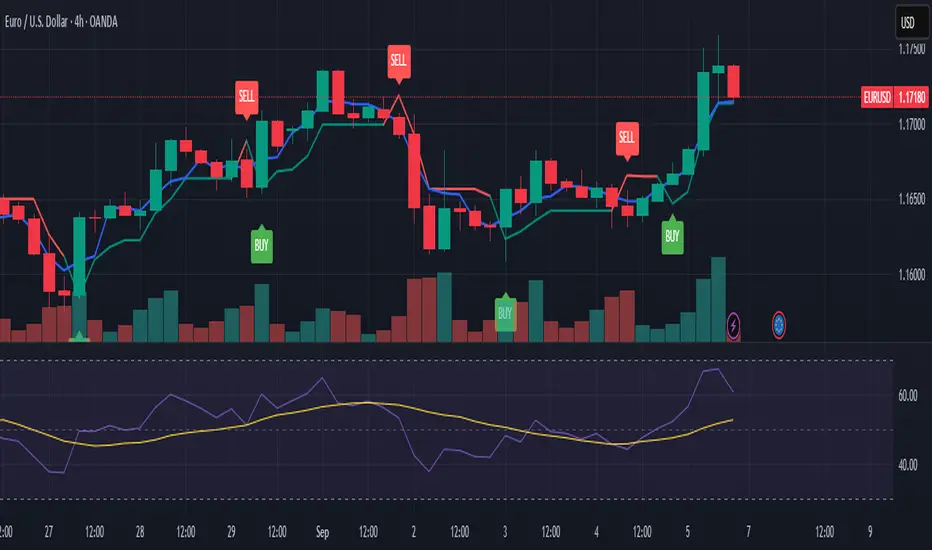
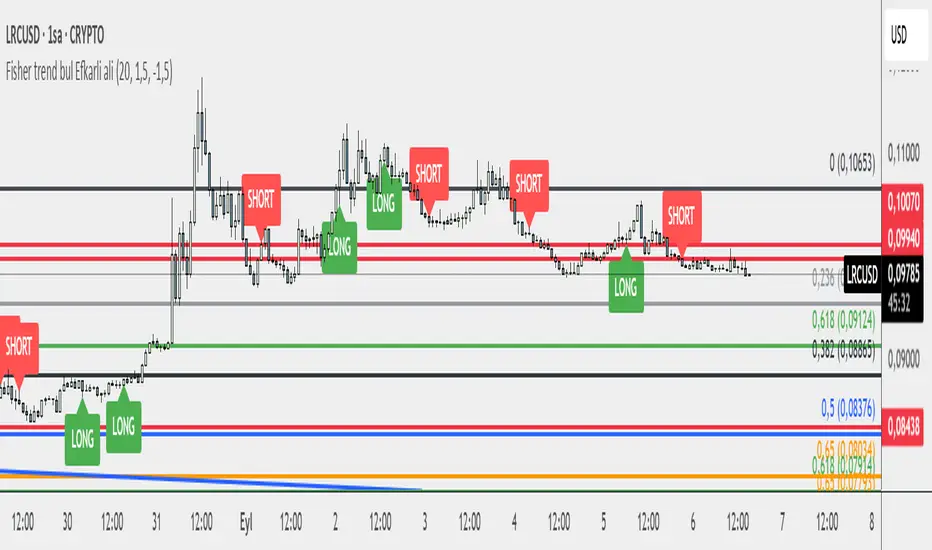
Fisher trend/ Efkarli aliThe fisher indicator applies the Fisher Transform indicator to generate buy and sell signals. It shows potential trend reversal points directly on the chat with clear viiual markers. Users can arrange sensitivty parameters to best fit of their trading strategy. The signals are easy to follow and providing a simple yet very effective way to track market momentum in real time.
You can use it very easily and in this time I will continue the improving the algorithm for better solutions for you..
交易区本地时间This is a practical timezone display indicator designed specifically for forex and global market traders, showing real-time current times of three major financial centers in a clear table format at the top-right corner of the chart: Tokyo, New York, and London.
✨ Key Features
🗾 Tokyo Time - Asian trading session reference
🗽 New York Time - American trading session reference
🏛️ London Time - European trading session reference
📅 Complete Date & Time - Display format: MM-DD HH:MM
🔄 Automatic DST - Smart handling of daylight saving time transitions
🎨 Color Coding - Different colors for different timezone identification
⚡ Real-time Updates - Based on current timestamp, accurate with no delay
💼 Use Cases
Forex Traders - Track major financial center opening/closing times
Global Market Analysis - Understand market activity across different timezones
News Trading - Master timing of important economic data releases
Multi-timezone Coordination - Time management tool for international investors
这是一个专为外汇和全球市场交易者设计的实用时区显示指标,在图表右上角以清晰的表格形式实时显示三大主要金融中心的当前时间:东京、纽约和伦敦。
✨ 主要功能
🗾 东京时间 - 亚洲交易时段参考
🗽 纽约时间 - 美洲交易时段参考
🏛️ 伦敦时间 - 欧洲交易时段参考
📅 完整日期时间 - 显示格式:MM-DD HH:MM
🔄 自动夏令时 - 智能处理冬令时/夏令时切换
🎨 色彩区分 - 不同颜色标识不同时区
⚡ 实时更新 - 基于当前时间戳,准确无延迟
💼 适用场景
外汇交易者 - 把握各大金融中心开盘收盘时间
全球市场分析 - 了解不同时区的市场活跃度
新闻交易 - 掌握重要经济数据发布时间
多时区协调 - 国际投资者的时间管理工具


Volume Profile AnalysisThe Volume Profile Dashboard is a professional-grade analysis tool built for TradingView. It focuses on displaying a comprehensive volume profile breakdown within a dashboard format directly on the chart. The purpose of this tool is to help traders quickly assess buy versus sell volume dynamics, momentum, and sentiment in order to support informed trading decisions.
Instead of plotting simple bars, this indicator uses a detailed table and visual progress bar to summarize live and historical market activity. By condensing key metrics into a structured format, traders can analyse market behaviour without manually calculating or switching between multiple indicators.
________________________________________
How the Script Works
1. Data Gathering
The script uses lower-timeframe price and volume data to calculate buy volume, sell volume, and total traded volume for the current and previous candles.
2. Volume Allocation
Buy and sell volumes are estimated by looking at the candle’s range (high to low) and how the closing price aligns within that range. The closer the close is to the high, the stronger the buying pressure. The closer the close is to the low, the stronger the selling pressure.
3. Delta and Momentum
o Delta measures the difference between buy and sell volume.
o Volume momentum compares the current candle’s activity to the previous one, showing if interest is rising or fading.
4. Point of Control (POC)
An average of high, low, and close is calculated to give an approximate “point of control” level—an area of balance where buyers and sellers previously agreed on price.
5. Dashboard Visualization
All these calculations are displayed inside a clean dashboard table with separate rows for the current candle, previous candle, and a summary row. Icons, colors, and progress bars make it visually intuitive.
6. On-Chart Progress Indicator
A dynamic horizontal progress bar is plotted on the chart above price, showing the balance between buy and sell volume for the latest activity.
7. Alerts
Built-in alerts trigger when strong buying or selling pressure is detected or when there is a significant spike in total traded volume.
________________________________________
How This Tool Can Be Used
• Intraday Trading: Quickly gauge whether buyers or sellers are in control of the market at any moment.
• Swing Trading: Compare momentum shifts between candles to identify early trend reversals.
• Risk Management: Use delta and sentiment signals to confirm whether to hold or reduce exposure.
• Confirmation: Align the volume profile dashboard with other indicators (such as RSI, MACD, or trendlines) for stronger trading conviction.
________________________________________
Using Mixed Indicators for Decisions
This dashboard alone provides volume insights, but better decisions come when it is combined with other tools:
• Pairing it with an RSI can show whether heavy buying is happening in overbought conditions.
• Combining with a SuperTrend or moving averages can confirm if volume momentum aligns with the price trend.
• Overlaying support/resistance levels can identify whether strong buy/sell signals occur at critical levels.
Mixed indicators prevent relying on one signal alone, reducing false trades.
________________________________________
Importance of This Tool
• Clarity: Condenses complex volume data into a simple, visual format.
• Speed: Traders can react faster with pre-calculated buy/sell percentages.
• Precision: Highlights hidden imbalances that are not obvious from candles alone.
• Professional-grade dashboard: Offers an institutional-style view of market behavior directly within TradingView.
________________________________________
Parameters in the Dashboard Table
• Period: Shows whether the row is for the current or previous candle, along with trend arrows.
• Price Range: The high–low range of the candle.
• Total Volume: The sum of buy and sell activity.
• Buy Volume / Sell Volume: Separated distribution of transactions leaning bullish or bearish.
• Delta: The net difference between buy and sell volumes, highlighting pressure imbalance.
• Buy % / Sell %: The percentage contribution of each side to total volume.
• POC: An average reference level where market consensus was strongest.
• Progress: A graphical bar showing buy vs sell dominance.
• Signal: Simplified output like Strong Buy, Buy, Strong Sell, Sell, Neutral.
• Summary Row: Compares changes between the current and previous candles and gives overall market sentiment.
________________________________________
Stock Market Disclaimer
This tool is for educational and informational purposes only. It does not constitute financial advice, investment advice, or trading recommendations. The stock market and cryptocurrency markets involve high risk. Traders and investors should do their own research and consult licensed financial advisors before making investment decisions. Past performance is not indicative of future results.
________________________________________
Misuse Disclaimer
This script has been developed as per TradingView’s rules and is intended for responsible trading analysis only. Any misuse, redistribution, or modification outside of TradingView’s policies is discouraged. The author and platform are not responsible for financial losses, misinterpretation of signals, or misuse of the code.
________________________________________
Disclaimer
Training & Educational Only — This material and the indicator are provided for educational purposes only. Nothing here is investment advice or a solicitation to buy or sell financial instruments. Past simulated or historical performance does not predict future results. Always perform full back testing and risk management, and consider seeking advice from a qualified financial professional before trading with real capital.
________________________________________

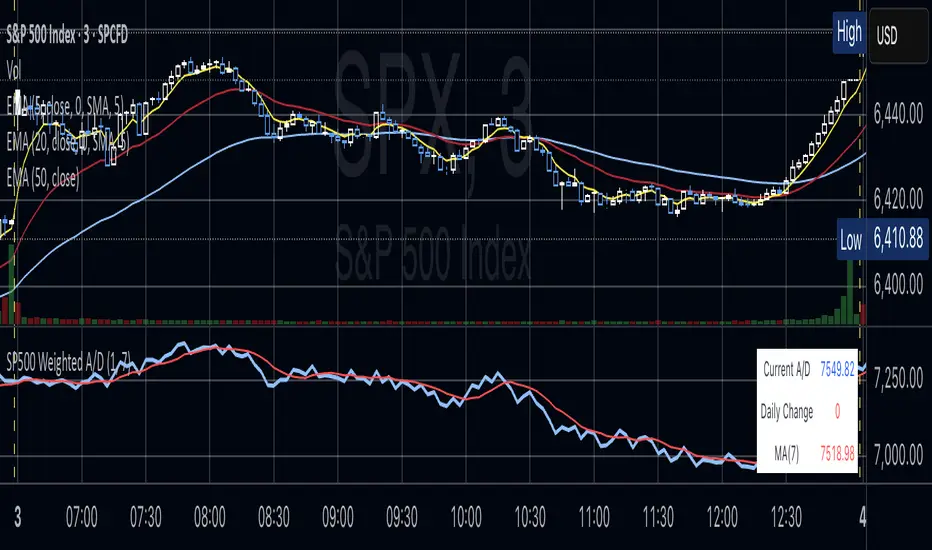
S&P 500 Weighted Advance Decline LineS&P 500 Weighted Advance Decline Line Indicator
Overview
This indicator creates a market cap weighted advance/decline line for the S&P 500 that tracks breadth based on actual index weights rather than treating all stocks equally. By weighting each stock's contribution according to its true S&P 500 impact, it provides more accurate market breadth analysis and better insights into underlying market strength and potential turning points.
Key Features
Market Cap Weighted: Each stock contributes based on its actual S&P 500 weight
Top 40 Stocks: Covers ~51% of the index with the largest companies
(limited by TradingView's 40 security call maximum for Premium accounts)
Real-Time Updates: Cumulative line shows long-term breadth trends
Visual Indicators: Background coloring, moving average option, and data table
Stock Coverage
Sector Breakdown:
Technology (29.8%) - Dominates the coverage as expected
Financials (5.8%) - Major banking and payment companies
Consumer/Retail (3.7%) - Consumer staples and retail giants
Healthcare (3.2%) - Pharma and healthcare services
Communication (1.97%) - Telecom and tech services
Energy (1.35%) - Oil and gas majors
Industrial (0.9%) - Aerospace and industrial equipment
Other Sectors (4.6%) - Miscellaneous including software and payments
Includes the 40 largest S&P 500 companies by weight, featuring:
Tech Leaders (29.8%): AAPL (7.0%), MSFT (6.5%), NVDA (4.5%), AMZN (3.5%), META (2.5%), GOOGL/GOOG (3.8%), AVGO (1.5%), ORCL (1.22%), AMD (0.51%), plus others
Financials (5.8%): BRK.B (1.8%), JPM (1.2%), V (1.0%), MA (0.8%), BAC (0.63%), WFC (0.46%)
Healthcare (3.2%): LLY (1.2%), UNH (1.2%), JNJ (1.1%), ABBV (0.8%), PG (0.9%)
Consumer/Retail (3.7%): WMT (0.8%), HD (0.8%), COST (0.7%), KO (0.6%), PEP (0.6%), NKE (0.4%)
Communication (1.97%): TMUS (0.47%), CSCO (0.47%), DIS (0.5%), CRM (0.5%)
Energy** (1.35%): XOM (0.8%), CVX (0.55%)
Industrial** (0.9%): GE (0.5%), BA (0.4%)
Other Sectors (4.6%): PLTR (0.65%), ADBE (0.6%), PYPL (0.3%), plus others
How to Interpret
Trend Signals
Rising A/D Line: Broad market strength, more weighted buying than selling
Falling A/D Line: Market weakness, more weighted selling pressure
Flat A/D Line: Balanced market conditions
Divergence Analysis
Bullish Divergence: S&P 500 makes new lows but A/D Line holds higher
Bearish Divergence: S&P 500 makes new highs but A/D Line fails to confirm
Confirmation
Strong trends occur when both price and A/D Line move in the same direction
Weak trends show when price moves but breadth doesn't follow
Settings
Lookback Period: Days for advance/decline comparison (default: 1)
Show Moving Average: Optional trend smoothing
MA Length: Moving average period (default: 20)
Limitations
Covers ~51% of S&P 500 (not complete market breadth)
Optimized for TradingView Premium accounts (40 security limit)
Heavy weighting toward mega-cap technology stocks
Dependent on real-time data quality
15-Min EMA CrossoverVery useful swing setup indicator that can be used in different styles of trading
Works on any timeframe but calculates EMA and cross signals based on 15-minute candles.
Plots the EMA line.
Shows green triangle for bullish crossover and red triangle for bearish crossunder.

Smart Breadth [smartcanvas]Overview
This indicator is a market breadth analysis tool focused on the S&P 500 index. It visualizes the percentage of S&P 500 constituents trading above their 50-day and 200-day moving averages, integrates the McClellan Oscillator for advance-decline analysis, and detects various breadth-based signals such as thrusts, divergences, and trend changes. The indicator is displayed in a separate pane and provides visual cues, a summary label with tooltip, and alert conditions to highlight potential market conditions.
The tool uses data symbols like S5FI (percentage above 50-day MA), S5TH (percentage above 200-day MA), ADVN/DECN (S&P advances/declines), and optionally NYSE advances/declines for certain calculations. If primary data is unavailable, it falls back to calculated breadth from advance-decline ratios.
This indicator is intended for educational and analytical purposes to help users observe market internals. My intention was to pack in one indicator things you will only find in a few. It does not provide trading signals as financial advice, and users are encouraged to use it in conjunction with their own research and risk management strategies. No performance guarantees are implied, and historical patterns may not predict future market behavior.
Key Components and Visuals
Plotted Lines:
Aqua line: Percentage of S&P 500 stocks above their 50-day MA.
Purple line: Percentage of S&P 500 stocks above their 200-day MA.
Optional orange line (enabled via "Show Momentum Line"): 10-day momentum of the 50-day MA breadth, shifted by +50 for scaling.
Optional line plot (enabled via "Show McClellan Oscillator"): McClellan Oscillator, colored green when positive and red when negative. Can use actual scale or normalized to fit breadth percentages (0-100).
Horizontal Levels:
Dotted green at 70%: "Strong" level.
Dashed green at user-defined green threshold (default 60%): "Buy Zone".
Dashed yellow at user-defined yellow threshold (default 50%): "Neutral".
Dotted red at 30%: "Oversold" level.
Optional dotted lines for McClellan (when shown and not using actual scale): Overbought (red), Oversold (green), and Zero (gray), scaled to fit.
Background Coloring:
Green shades for bullish/strong bullish states.
Yellow for neutral.
Orange for caution.
Red for bearish.
Signal Shapes:
Rocket emoji (🚀) at bottom for Zweig Breadth Thrust trigger.
Green circle at bottom for recovery signal.
Red triangle down at top for negative divergence warning.
Green triangle up at bottom for positive divergence.
Light green triangle up at bottom for McClellan oversold bounce.
Green diamond at bottom for capitulation signal.
Summary Label (Right Side):
Displays current action (e.g., "BUY", "HOLD") with emoji, breadth percentages with colored circles, McClellan value with emoji, market state, risk/reward stars, and active signals.
Hover tooltip provides detailed breakdown: action priority, breadth metrics, McClellan status, momentum/trend, market state, active signals, data quality, thresholds, recent changes, and a general recommendation category.
Calculations and Logic
Breadth Percentages: Derived from S5FI/S5TH or calculated from advances/(advances + declines) * 100, with fallback adjustments.
McClellan Oscillator: Difference between fast (default 19) and slow (default 39) EMAs of net advances (advances - declines).
Momentum: 10-day change in 50-day MA breadth percentage.
Trend Analysis: Counts consecutive rising days in breadth to detect upward trends.
Breadth Thrust (Zweig): 10-day EMA of advances/total issues crossing from below a bottom level (default 40) to above a top level (default 61.5). Can use S&P or NYSE data.
Divergences: Compares S&P 500 price highs/lows with breadth or McClellan over a lookback period (default 20) to detect positive (bullish) or negative (bearish) divergences.
Market States: Determined by breadth levels relative to thresholds, trend direction, and McClellan conditions (e.g., strong bullish if above green threshold, rising, and McClellan supportive).
Actions: Prioritized logic (0-10) selects an action like "BUY" or "AVOID LONGS" based on signals, states, and conditions. Higher priority (e.g., capitulation at 10) overrides lower ones.
Alerts: Triggered on new occurrences of key conditions, such as breadth thrust, divergences, state changes, etc.
Input Parameters
The indicator offers customization through grouped inputs, but the use of defaults is encouraged.
Usage Notes
Add the indicator to a chart of any symbol (though designed around S&P 500 data; works best on daily or higher timeframes). Monitor the label and tooltip for a consolidated view of conditions. Set up alerts for specific events.
This script relies on external security requests, which may have data availability issues on certain exchanges or timeframes. The fallback mechanism ensures continuity but may differ slightly from primary sources.
Disclaimer
This indicator is provided for informational and educational purposes only. It does not constitute investment advice, financial recommendations, or an endorsement of any trading strategy. Market conditions can change rapidly, and users should not rely solely on this tool for decision-making. Always perform your own due diligence, consult with qualified professionals if needed, and be aware of the risks involved in trading. The author and TradingView are not responsible for any losses incurred from using this script.

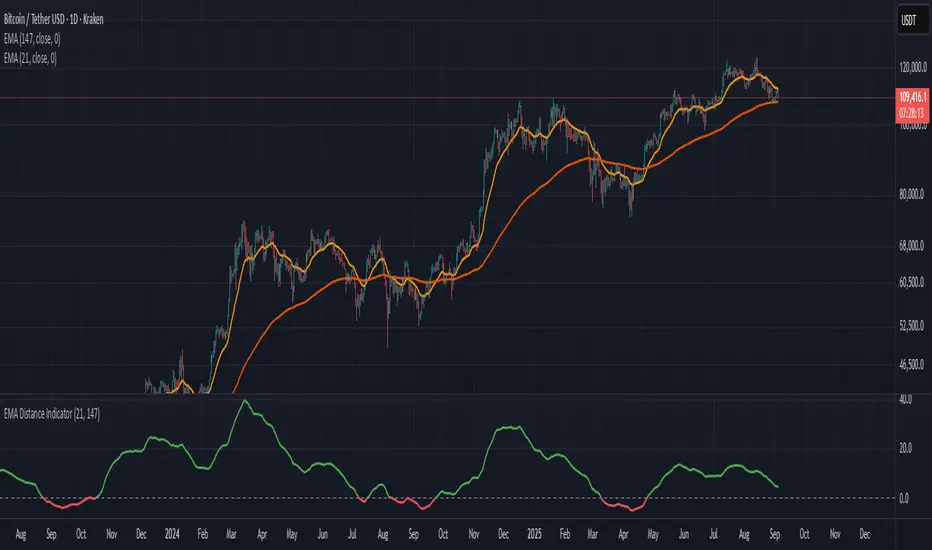
Distance Between EMA'sThis indicator measures the distance between any two EMA's you choose. You can change the EMA's by clicking settings and change the inputs to the two that you choose
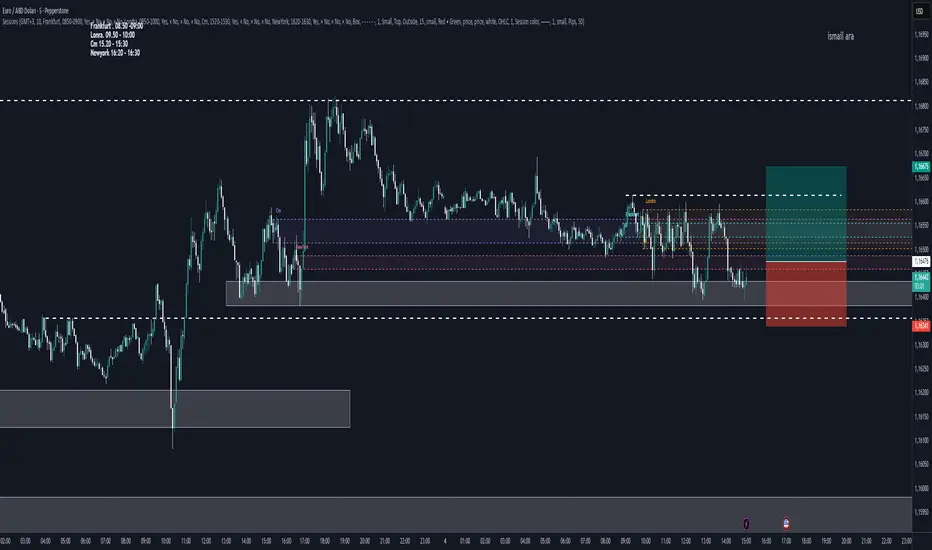
FX Market Sessions serkanMarket stock market opening and closing indicators
Opening and closing time ranges
Frankfurt
London
CM
New York opening and closing time ranges
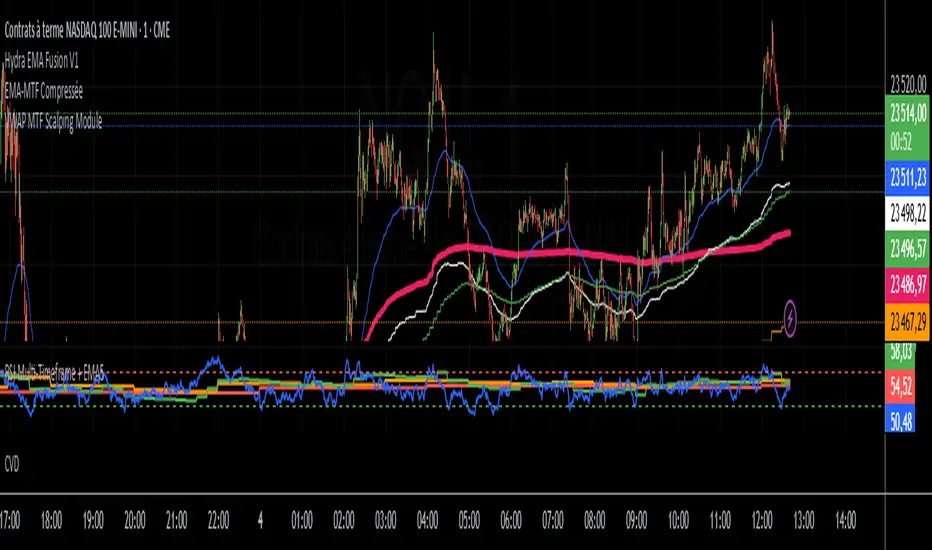
VWAP MTF Scalping ModuleThe VWAP MTF indicator allows you to visualize anchored VWAP across multiple timeframes, while maintaining a clean and responsive display.
Designed for intraday traders, scalpers, and swing traders, this module offers a clear view of volume-weighted average price zones across key timeframes (1m, 5m, 15m, 1h... customizable).
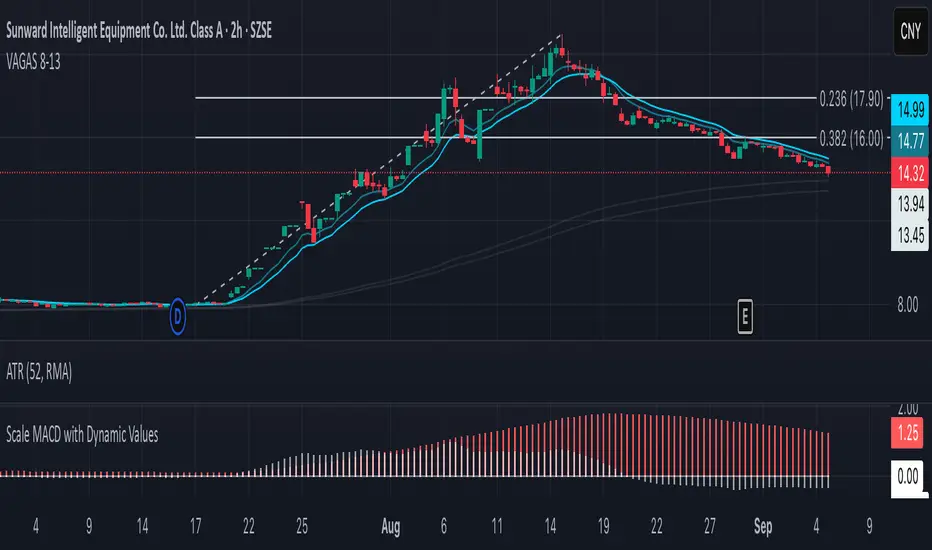
Vagas-dctang(8~13)Overview
The Vegas Tunnel EMA 8-13 is a refined technical analysis indicator that utilizes two key exponential moving averages (8-period and 13-period EMAs) to create a dynamic tunnel system for identifying trend direction and potential support/resistance zones. This indicator is specifically designed to help traders visualize price action within the context of short-term trend dynamics.
Key Features
✅ Dual EMA Tunnel System: Creates a visual tunnel between 8 EMA (fast) and 13 EMA (slow) to identify trend channels ✅ Dynamic Support Detection: The tunnel acts as dynamic support during uptrends and resistance during downtrends ✅ Trend Confirmation: Price position relative to the tunnel helps confirm the current market trend ✅ Entry/Exit Signals: Tunnel crossovers and price interactions provide clear trading signals ✅ Multi-Timeframe Compatible: Works effectively across various timeframes from scalping to swing trading
How It Works
The Vegas Tunnel EMA 8-13 operates on the principle that shorter-period EMAs react more quickly to price changes, creating a responsive tunnel system:
Bullish Tunnel: When 8 EMA > 13 EMA, the tunnel indicates an upward trend with potential support zones
Bearish Tunnel: When 8 EMA < 13 EMA, the tunnel indicates a downward trend with potential resistance zones
Tunnel Width: The distance between EMAs indicates trend strength and volatility
Price Interaction: Bounces off the tunnel boundaries suggest trend continuation, while breaks may signal reversals
Trading Applications
Trend Following: Use tunnel direction to align trades with the prevailing trend
Support/Resistance Trading: Enter long positions when price bounces off tunnel support, short when rejected at resistance
Breakout Strategy: Trade tunnel breaks as potential trend continuation or reversal signals
Risk Management: Use tunnel boundaries as dynamic stop-loss levels
Advantages Over Traditional Moving Averages
Reduced Noise: The tunnel system filters out minor price fluctuations
Visual Clarity: Easy identification of trend channels and key levels
Faster Response: 8-13 period combination provides quicker signals than longer-term systems
Versatile Application: Suitable for various trading styles and market conditions
Best Practices
Combine with volume analysis for stronger signal confirmation
Consider higher timeframe tunnel direction for context
Use proper risk management with position sizing
Backtest on your preferred instruments and timeframes
This indicator is ideal for traders seeking a clean, effective tool for trend analysis and dynamic support/resistance identification in fast-moving markets.
Big Orders Detector - Whale Activity SpotterDetect Institutional & Whale Trading Activity with Volume Analysis
This indicator helps traders identify significant buy/sell orders (whale activity) by analyzing volume spikes and price movements. Perfect for spotting institutional entries and exits.
📊 Key Features:
Volume Spike Detection - Identifies when volume exceeds average by customizable multiplier
Price Movement Analysis - Tracks significant price changes with adjustable threshold
Smart Direction Detection - Distinguishes between big buy and sell orders
Visual Markers - Clear arrows, background highlights, and detailed labels
Flexible Settings - Fully customizable parameters for different trading styles
Statistics Table - Optional real-time order count tracking
Alert System - Built-in alerts for automated notifications
⚙️ How It Works:
The indicator combines volume analysis with price movement detection to identify unusual market activity. When volume significantly exceeds the moving average AND price shows meaningful movement, it marks these as potential whale orders.
🎯 Best Used For:
Crypto markets with high volume activity
Forex pairs during major news events
Stock trading around earnings/announcements
Identifying institutional accumulation/distribution
📈 Settings Guide:
Volume Multiplier (3.0) - How many times above average volume (recommended minimum: 3.0)
Volume Period (20) - Moving average period for volume
Price Threshold (1.5%) - Minimum price change requirement
Visual Options - Toggle arrows, labels, and background highlights
💡 Trading Tips:
Use on liquid markets with consistent volume
Combine with support/resistance levels
Higher timeframes show more significant orders
Adjust sensitivity based on market volatility
⚠️ Important Notes:
Not financial advice - for educational purposes only
Past performance doesn't guarantee future results
Always use proper risk management
Test parameters on your specific markets
Perfect for swing traders, day traders, and anyone looking to spot whale activity in their favorite markets!

4-Hour Range HighlighterThe 4-Hour Range Highlighter is a powerful visual analysis tool designed for traders operating on lower timeframes (like 5m, 15m, or 1H). It overlays the critical price range of the 4-hour (4H) candlestick onto your chart, providing immediate context from a higher timeframe. This helps you align your intraday trades with the dominant higher-timeframe structure, identifying key support and resistance zones, breakouts, and market volatility at a glance.
Key Features:
Visual Range Overlay: Draws a semi-transparent colored background spanning the entire High and Low of each 4-hour period.
Trend-Based Coloring: Automatically colors the range based on the 4H candle's direction:
Green: Bullish 4H candle (Close > Open)
Red: Bearish 4H candle (Close < Open)
Blue: Neutral 4H candle (Close = Open)
Customizable High/Low Lines: Optional, subtle lines plot the exact high and low of the 4H bar, acting as dynamic support/resistance levels.
Fully Customizable: Easily change colors and toggle visual elements on/off in the settings to match your chart's theme.
How to Use It:
Identify Key Levels: The top and bottom of the shaded area represent significant intraday support and resistance. Watch for price reactions at these levels.
Trade in Context: Use the trend color to gauge sentiment. For example, look for buy opportunities near the low of a bullish (green) 4H range.
Spot Breakouts: A strong candle closing above the high or below the low of the current 4H range can signal a continuation or the start of a new strong move.
Gauge Volatility: A large shaded area indicates a high-volatility 4H period. A small area suggests consolidation or low volatility.
Settings:
Visual Settings: Toggle the background and choose colors for Bullish, Bearish, and Neutral ranges.
Line Settings: Toggle the high/low lines and customize their colors.
Note: This is a visual aid, not a standalone trading system. It provides context but does not generate buy/sell signals. Always use it in conjunction with your own analysis and risk management.
Perfect for Day Traders, Swing Traders, and anyone who needs higher-timeframe context on their chart!
How to Use / Instructions:
After adding the script to your chart, open the settings menu (click on the indicator's name and then the gear icon).
In the "Inputs" tab, you will find two groups: "Visual Settings" and "Line Settings".
In Visual Settings, you can:
Toggle Show 4H Range Background on/off.
Change the Bullish Color, Bearish Color, and Neutral Color for the transparent background.
In Line Settings, you can:
Toggle Show High/Low Lines on/off.
Change the line colors for each trend type.
Adjust the colors to your preference. The default settings use transparency for a clean look that doesn't clutter the chart.

BTC Power-Law Decay Channel Oscillator (0–100)🟠 BTC Power-Law Decay Channel Oscillator (0–100)
This indicator calculates Bitcoin’s position inside its long-term power-law decay channel and normalizes it into an easy-to-read 0–100 oscillator.
🔎 Concept
Bitcoin’s long-term price trajectory can be modeled by a log-log power-law channel.
A baseline is fitted, then an upper band (excess/euphoria) and a lower band (capitulation/fear).
The oscillator shows where the current price sits between those bands:
0 = near the lower band (historical bottoms)
100 = near the upper band (historical tops)
📊 How to Read
Oscillator > 80 → euphoric excess, often cycle tops
Oscillator < 20 → capitulation, often cycle bottoms
Works best on weekly or bi-weekly timeframes.
⚙️ Adjustable Parameters
Anchor date: starting point for the power-law fit (default: 2011).
Smoothing days: moving average applied to log-price (default: 365 days).
Upper / Lower multipliers: scale the bands to align with historical highs and lows.
✅ Best Use
Combine with other cycle signals (dominance ratios, macro indicators, sentiment).
Designed for long-term cycle analysis, not intraday trading.

