SEE + RSI Signal with Dual Invalidationrsi mcd and see close signal. when a candle closes below rsi, see and macd the script prints a tiny circleאינדיקטור Pine Script®מאת aditisvegeta1
V Stop MTF → STRATEGY Why this strategy works so well (your backtest proves it): FeatureBenefitMulti-timeframe Volatility StopSmarter trend detection than single TFRepainting controlYou can choose safe non-repainting modeLimbo/breach detectionAvoids whipsaws during HTF conflictsReversing systemAlways in the market → captures all trendsCandle coloring on reversalInstant visual confirmation Recommended settings that match your +17.33% result: Symbol: SP:SPX or ES1! Timeframe: 9min or 15min Heikin-Ashi HTF: "Multiple Of Current TF" × 3 → gives ~45min on 15min chart ATR Length: 20 ATR Factor: **2.0 אסטרטגיית Pine Script®מאת PawelMr14
ADX Breakout Enhanced Signal🥋 Trading Dojo – ADX Breakout Enhanced Signal This indicator combines the trend-strength power of the ADX with dynamic breakout-based signals, designed for traders who want more frequent and higher-probability entries on timeframes like 1 hour. The core logic focuses on: 📌 1. Trend Strength Detection with ADX The indicator evaluates whether the market is showing a strong directional trend using an optimized ADX. When ADX rises above the configured threshold, the system interprets that price has enough momentum to validate an entry. 📌 2. Breakout Entry Logic It identifies points where price breaks recent highs or lows, confirming the start or continuation of movement. This breakout-based approach produces more entries than traditional ADX strategies alone. 📌 3. Clear and Simple Signals 🟩 Long when price breaks a recent high with strong trend confirmation. 🟥 Short when price breaks a recent low with strong trend confirmation. 📌 4. Built-In Automated Alerts The indicator automatically generates JSON alerts ready for use with automation tools such as trading bots, webhooks, BingX, 3Commas, Discord bots, and more. 🎯 Purpose of the Indicator To provide more frequent, well-distributed, and momentum-validated entries, while maintaining simplicity and speed — perfect for real-time decision-making. Perfect For: Intraday trading 1h, 30m, and 15m timeframes Breakout-based strategies Automated trading systemsאינדיקטור Pine Script®מאת Mike-Caves15
BullTrading Bias Line🚀BullTrading Magnet Bias Line🚀(多空平衡线|磁吸区) 一条基于锚定 VWAP 的「多空平衡线」,并在其周围构建可视化的磁吸区,用于刻画日内多空力量的平衡、中枢与偏离程度。 核心特性 • 多种锚定模式:支持 Session / Daily / Weekly / Manual 四种模式,可按交易日、自然日、周线或自定义时间作为 VWAP 起点。 • 磁吸区(Magnet Zone):在 VWAP 上下按 波动 自动生成带宽,形成价格围绕平衡线的「磁吸区」,可视化震荡与均值回归区域。 • 发光平衡线(Bias Line Glow):双线叠加的发光效果,让主线在复杂图表中一眼可见。 • 多空方向着色: • 价格在平衡线之上:多头区域(绿色) • 价格在平衡线之下:空头区域(红色) • 位于磁吸区:均衡/盘整(金色) • 事件标记与报警:支持 • 价格向上/向下穿越多空平衡线 • 首次进入磁吸区 • 状态灯面板:左下角给出当前状态(上方 / 下方 / 磁吸 / 无效),方便截图和教学使用。 使用建议 • 在 3m / 5m / 15m 等短周期中,将本线作为大致多空平衡价与回调参考: • 价格多次从上方回踩磁吸区并企稳,偏多; • 价格多次从下方反抽磁吸区受压,偏空; • 长时间在磁吸区内盘整,意味着趋势模糊、均值回归占主导。 • 指标本身不直接提供买卖点,更适合作为你已有交易系统的环境过滤、位置参考与风控辅助线。 本指标仅用于技术研究与图表分析,不构成任何投资建议或交易信号,请根据自身风险承受能力独立决策。 BullTrading Magnet Bias Line🚀 (VWAP-Anchored Bias & Magnet Zone) A bias line built on anchored VWAP, with a visual magnet zone around it to describe intraday bull–bear balance, value area, and how far price has deviated from that balance. ⸻ Key Features • Multiple anchor modes – Supports four VWAP anchor modes: Session / Daily / Weekly / Manual, so you can start VWAP from the trading session, calendar day, week, or any custom time. • Magnet Zone – The upper and lower bands around VWAP are generated adaptively from volatility, forming a “magnet area” where price tends to oscillate and revert to the mean. • Glow Bias Line – A double-layer glow effect on the main line makes the bias axis stand out clearly even on crowded charts. • Directional coloring • Price above the bias line → bullish region (green) • Price below the bias line → bearish region (red) • Price inside the magnet zone → equilibrium / consolidation (gold) • Event markers & alerts – Supports: • Price crossing upward / downward through the bias line • First entry into the magnet zone • Status lamp panel – Bottom-left panel shows the current state (Above / Below / In Magnet / Invalid), which is convenient for screenshots, education and review. ⸻ How to Use • On short intraday timeframes such as 3m / 5m / 15m, treat the line as an approximate bull–bear fair value and a pullback reference: • Repeated tests of the magnet zone from above that hold → bullish bias • Repeated tests of the magnet zone from below that get rejected → bearish bias • Long consolidation inside the magnet zone → unclear trend, mean-reversion regime dominates • The script itself does not generate direct entry/exit signals. It works best as an environment filter, location reference, and risk-management helper alongside your existing trading system. ⸻ This indicator is for technical research and chart analysis only. It does not constitute investment advice or trading signals. Please make your own decisions according to your personal risk tolerance.אינדיקטור Pine Script®מאת OutsiderTrader6669
BullTrading Axis Ribbon (MTF)BullTrading Axis Ribbon (MTF) BullTrading Axis Ribbon 是一条「高周期主轴 + 自适应包络带」的趋势彩带,用来刻画价格围绕关键均衡轴的磁吸区、扩散区与趋势方向。 • 主轴(Axis Ribbon):使用更高时间级别的价格数据,在当前周期上映射一条「日内趋势中轴」。默认适合在 3m / 5m 图上调用 15m 主轴。 • 中枢区(Core Zone):主轴上下的窄区间,用彩带填充显示。当价格在中枢区震荡时,代表围绕均衡轴的磁吸与盘整。 • 外圈带(Outer Band):位于中枢之外的扩展区,用于观察顺势扩张与「过热」区域,可选线框或填充显示。 • 颜色逻辑: • 轴线彩带根据趋势方向与中枢状态变色:上升(绿色)、下降(红色)、中枢磁吸(黄色)、整理(灰色)。 • 左下角状态灯同步给出当前轴向状态(上涨 / 下跌 / 中枢 / 整理)。 使用建议 • 在 3m / 5m 作为短周期信号时,用 Axis Ribbon 作为「大级别方向过滤」与「高概率回踩区域」参考。 • 价格长时间贴着外圈带运行,可视为顺势加速或过热区;频繁回到中枢,则倾向震荡与均值回归。 • 指标本身不直接给出买卖点,更适合与你已有的进场离场系统配合,用于方向过滤和环境判断。 本指标仅用于技术研究与图表分析,不构成任何投资建议或交易信号,请根据自身风险承担能力独立决策。 BullTrading Axis Ribbon (MTF) BullTrading Axis Ribbon is a trend ribbon built from a higher-timeframe core axis + adaptive envelope bands. It depicts the magnet zone, expansion zone and trend direction of price around a key equilibrium axis. • Axis (Axis Ribbon): Uses higher-timeframe price data to project an “intraday trend spine” onto the current chart. By default it works well using a 15m axis on 3m / 5m charts. • Core Zone: A narrow band above and below the axis, displayed as a filled ribbon. When price oscillates inside the Core Zone, it reflects magnet behavior and consolidation around the equilibrium axis. • Outer Band: An extended area outside the Core Zone, used to observe trend extension and potential “overheated” zones. It can be shown as simple lines or as a filled band. • Color Logic: • The axis ribbon color changes with trend direction and core state: uptrend (green), downtrend (red), core/magnet (yellow), ranging/flat (gray). • A status lamp in the bottom-left corner simultaneously shows the current axis state (Up / Down / Core / Flat). Usage Suggestions • When using 3m / 5m as your signal timeframe, treat Axis Ribbon as a higher-timeframe bias filter and as a reference for high-probability pullback areas. • If price rides along the Outer Band for an extended period, it can be interpreted as trend acceleration or a potential overheated zone; if price frequently returns to the Core Zone, the market tends to be ranging with mean-reversion behavior. • The indicator itself does not directly generate entry/exit signals. It is best used together with your existing entry/exit systems, as a tool for directional filtering and market-regime assessment. This indicator is intended solely for technical research and chart analysis. It does not constitute investment advice or a trading signal. Please make independent decisions according to your own risk tolerance.אינדיקטור Pine Script®מאת OutsiderTrader6669
ATM PROThe world’s strongest indicator that combines multiple indicators together, providing you with entry points, targets, and stop-loss levels with extreme accuracy. You can adjust its inputs to suit Forex and crypto pairs according to your needs. It contains these tools, and you can modify them based on your requirements. المؤشر الاقوى عالميا الذي جمع عدة مؤشرات معا , من خلاله سيعطيك نقاط ( دخول واهداف وايقاف خسارة ) بدقة متناهية وتستطيع ان تعدل المدخلات ليتناسب مع ازواج الفوركس والكريبتو بشكل يتناسب مع ما تحتاجه يحتوي على هذه الادوات ويمكنك تعديلها حسب متطلباتك SHORT EMA LONG EMA TREND EMA MACD SHORT MACD LONG MACD SIGNAL RSI LENGTH ATR LENGTH VOLUME MULTIPLIER ATR TARGET 1.2.3.4.5 STOP LOSS MULTIPLIER BY ATM TEAMאינדיקטור Pine Script®מאת ATM4TECH12
Cycle Forecast + MACD Divergence (Kombi v6 FULL)This indicator merges two powerful analytical models: 🔮 1. Dominant Cycle Forecasting The script automatically identifies major structural market cycles by detecting significant swing highs and lows. It then fits a sinusoidal wave (amplitude, phase, and period) to the dominant cycle and projects it into the future. Features: Automatically extracts large, dominant cycles (no noise, no small swings) Smooth sinusoidal historical cycle visualization Future cycle projection for 1–2 upcoming cycle periods Dynamic amplitude and phase alignment based on market structure Helps anticipate cycle tops and bottoms for long-term timing 📉 2. MACD Divergence Detection Full divergence detection engine using MACD or MACD Histogram. Detects: Bullish Divergence Price ↓ while MACD (or Histogram) ↑ → Possible trend reversal upward Bearish Divergence Price ↑ while MACD (or Histogram) ↓ → Possible trend reversal downward Features: Pivot-based divergence confirmation (no repaint) Choice of MACD Line or Histogram as divergence source Labels + connecting divergence lines Works across all markets and timeframes ⚙️ Smart Auto-Pivot System The indicator optionally adjusts pivot sensitivity based on timeframe: Weekly → tighter pivots Daily → medium pivots Intraday → wider pivots Ensures stable, meaningful divergence signals even on higher timeframes. 🎯 Use cases Identify upcoming cycle highs/lows Spot major trend reversals early Improve swing entries with MACD divergences near cycle turns Combine forecasting with momentum exhaustion Suitable for crypto, stocks, indices, forex & commodities 🧠 Why this indicator is powerful This tool blends time-based cycle forecasting with momentum-based divergence signals, giving you a unique perspective of where the market is likely to turn. Cycles reveal when a move may occur. Divergences reveal why a move may occur. Combined, they offer highly effective market timing.אינדיקטור Pine Script®מאת PythonWay65
Yellow Candle X:@BADPERSON129**Yellow Candle Strategy - Performance Overview** The Yellow Candle signal demonstrates moderate effectiveness with a success rate ranging from 30% to 60%. This strategy yields profit margins between 3% and 10%, depending on your portfolio management approach and market conditions. **Key Parameters:** - **Success Rate:** 30%-60% - **Profit Target:** 3%-10% - **Stop Loss:** 3%-8% **Risk Management Notes:** - Adjust position sizing according to your risk tolerance - Stop loss placement is crucial for capital preservation - The wide success rate range reflects varying market volatility - Portfolio diversification recommended when implementing this signal *Note: Performance may vary based on market conditions, timeframe selection, and proper risk management execution. Always backtest and forward test strategies before live implementation.*אסטרטגיית Pine Script®מאת nslm913
Simple SuperTrend & MACD Trend Follow 📈 SuperTrend-MACD Trend Follow Indicator This indicator is composed of the following two main components: SuperTrend: A filter that shows the direction of the long-term trend and a trailing stop level. A green color indicates an uptrend, and a red color indicates a downtrend. MACD (Moving Average Convergence Divergence): Captures changes in short-term momentum to determine entry and exit timings. 📈 SuperTrend-MACD Trend Follow Indicator This indicator is composed of the following two main components: SuperTrend: A filter that shows the direction of the long-term trend and a trailing stop level. A green color indicates an uptrend, and a red color indicates a downtrend. MACD (Moving Average Convergence Divergence): Captures changes in short-term momentum to determine entry and exit timings. ■日本語(Japanese) トレンドフォローをわかりやすく売買シグナルを出すようにカスタマイズ 1. トレンド方向の把握 (SuperTrend)チャート上に表示されるスーパートレンドラインの色を確認します。 🟢 緑色: 上昇トレンド(ロングを狙う) 🔴 赤色: 下降トレンド(ショートを狙う) 2. 売買シグナルの条件 ・BUY (買い): 1.SuperTrendが緑色であること。(上昇トレンドフィルター) 2.MACDがゴールデンクロス(MACDラインがシグナルラインを上抜け)したこと。(エントリータイミング) ・SELL (売り): 1.SuperTrendが赤色であること。(下降トレンドフィルター) 2.MACDがデッドクロス(MACDラインがシグナルラインを下抜け)したこと。(エントリータイミング) 3. 設定調整のポイントご自身のトレードスタイルに合わせて、設定(Inputs)を調整できます。 1.設定項目デフォルト調整の方向性SuperTrend Factor3.0上げると感度が下がり、シグナルが減る(大きなトレンド重視) 2.SuperTrend ATR Period10上げると滑らかになり、シグナルが減る 3.MACD Lengths12, 26, 9基本はデフォルト推奨。より速いエントリーを求めるなら短くする אינדיקטור Pine Script®מאת halrop12
Stoch+RSI Trend Strategy (Webhook Ready) En iyi ayarlar için lütfen geri dönüş yapmayı unutmayın.אסטרטגיית Pine Script®מאת zumahk5
EMA Divergence Channel (Only Above EMA 200)shows ema divergence above 200 ema. When the 7 ema diverges from 21 and 50 really fast, the channel shows upאינדיקטור Pine Script®מאת aditisvegeta2
ILXOMJON ILHAYilhay street H4 street xamisha siz lar b n privotlarאינדיקטור Pine Script®מאת ILHAY18
Relative Strength Scanner (10 tickers)Relative Strength Scanner Dashboard (10-Ticker Intraday) This powerful dashboard provides an efficient, at-a-glance view of the Relative Strength (RS) of up to 10 user-defined symbols against a chosen benchmark (e.g., SPY). It's designed for active traders who need to quickly identify market leaders and laggards across any timeframe, including intraday. How it Works: The indicator uses the time-tested concept of Relative Strength by comparing the percentage return of each stock against the percentage return of a reference index/ETF over the same period. Return Calculation: For each symbol, the script calculates the percent change over a user-defined Lookback Period (e.g., 20 bars) on a user-selected RS Timeframe (e.g., 60-minute, 4-hour, or Daily). Relative Strength: The RS value is the difference between the symbol's return and the benchmark's return. $ NYSE:RS = \text{Symbol Return} - \text{Benchmark Return}$$ Real-Time Dashboard: The results are displayed in a non-overlay table, highlighting the strongest performing asset (the Market Leader) with a distinct background color. Key Features: Intraday Capable: The RS Timeframe input allows you to accurately measure strength on smaller timeframes (e.g., 15m, 60m), ensuring the lookback window is calculated correctly based on the higher timeframe bars. Performance Reliability: The underlying logic ensures that the lookback calculation is performed within the request.security context, eliminating the common Pine Script error of mixing chart and security timeframes. At-a-Glance Leader Identification: The table visually highlights the top-performing symbol with the highest relative strength, making leader rotation instantly obvious. Configurable Watchlist: Easily input up to 10 symbols and any major index or ETF as your Benchmark Symbol. Clear Metrics: The dashboard shows three columns: Ticker Name, Absolute Return (%), and RS vs. Benchmark (%).אינדיקטור Pine Script®מאת Pogchamp99מעודכן 5
MAG7 + VWAP Confluence Regime FilterMAG7 + VWAP Confluence Regime Filter (with Market Breadth Table) The Ultimate Market State Detector for Intraday Futures & Index Traders This tool is a high-precision regime filter built for traders who want to avoid chop, trade only during clean directional flows, and align entries with the true leaders of the U.S. equity market — the MAG7. Instead of guessing trend, this indicator measures real-time leadership, institutional flow, and market conviction by monitoring the top seven market-driving stocks: AAPL, MSFT, AMZN, META, GOOGL, TSLA, NVDA For each symbol, the indicator checks whether price is above or below VWAP on a chosen intraday timeframe, then aggregates the results into a market breadth confluence score. When combined with the VWAP status of ES/MES (the chart you attach it to), this system becomes an extremely reliable Risk-On / Risk-Off classifier, filtering out low-quality environments and highlighting moments of strong directional bias.אינדיקטור Pine Script®מאת Pogchamp99מעודכן 9
SymFlex Band - MAD, RSI, ATRThe SymFlex Band is an adaptive volatility and momentum framework that merges three independent band models into a unified analytical tool. • The MAD Band measures deviation from the moving average using Median Absolute Deviation, providing a stable view of range-based volatility. • The RSI Momentum Band adjusts its upper and lower boundaries asymmetrically, expanding in the direction of momentum and contracting against it. • The ATR Band captures classical volatility expansion for breakout and trend-continuation conditions. Rather than placing the three indicators separately on a chart, the script synchronizes their center-line logic, compares their band distances, identifies the nearest active band, and displays real-time correlation between their dynamic ranges. This structure helps traders understand whether price behavior is dominated by range compression, momentum imbalance, or volatility expansion. The table summarizes: • active band ranges • breakout status • distance from each band • cross-band correlation This indicator is designed purely for analysis. It does not generate trade entries. אינדיקטור Pine Script®מאת surirang6
Heikin Ashi Background ColorHighlights the background of traditional candle sticks with the corresponding heiken ashi candle colour in order to avoid switching back and forth between heiken ashi and traditional candle sticks אינדיקטור Pine Script®מאת akhilpr1113
Crypto Signals & Overlays –29-11-2025Nebula Crypto Signals & Overlays Nebula is a multi-timeframe trend and momentum indicator designed for high-cap crypto pairs (BTC, ETH, SOL, DOGE, etc.). • Uses 21/50/200 EMAs + higher-timeframe EMA for trend filtering • RSI and Bollinger Bands for momentum and squeeze detection • Generates BUY/SELL labels on trend-side pullbacks • ATR line as a dynamic stop/target guide, plus pivot-based support/resistance zones • Background colors: green = bullish regime, red = bearish regime, yellow = low-volatility squeeze Not financial advice. Always backtest and use proper risk management before trading live.אינדיקטור Pine Script®מאת kamransheikh7067011
NQBA This indicator is designed for educational purposes only and aims to support traders in analyzing price action using a combination of advanced technical tools. The script provides: Overbought and oversold zones derived from deviation factors and momentum filters. Dynamic levels based on several adaptive moving averages (Adaptive EMA, Normal EMA, and Trend EMA). Enhanced trend lines calculated using ATR-based channel formulas with adjustable volatility filters. Visual signals intended to highlight trend direction, momentum shifts, and potential reversal areas. Dynamic support and resistance channels that adapt to market volatility. This indicator does not guarantee performance, profitability, or specific trading outcomes. It should not be considered financial or investment advice. Results may vary depending on market conditions and user inputs, and it is recommended to combine this indicator with additional analysis tools before taking any trading decision.هذا المؤشر مصمم لأغراض تعليمية فقط، ويهدف إلى مساعدة المتداول في تحليل حركة السعر باستخدام مزيج من الأدوات الفنية المتقدمة. يقوم المؤشر بعرض: مناطق التشبّع الشرائي والبيعي بناءً على معاملات الانحراف ومؤشرات الزخم. مستويات ديناميكية تعتمد على متوسطات متحركة تكيفية (Adaptive EMA – Normal EMA – Trend EMA). خطوط اتجاه محسّنة تعتمد على قيم النطاق اللحظي (ATR) مع استخدام خوارزميات لضبط حجم القناة. إشارات مرئية تساعد على متابعة الاتجاه العام والزخم وتحديد مناطق التحول المحتملة. قنوات دعم ومقاومة تعتمد على خطوط متغيرة حسب تذبذب السوق. لا يعتمد هذا المؤشر على معادلات تعطي نتائج مؤكدة، ولا يمثل نصيحة استثمارية أو مالية. قد تختلف نتائج الأداء من مستخدم لآخر ويجب استخدامه مع أدوات واستراتيجيات تحليل إضافية قبل اتخاذ أي قرار تداول. אינדיקטור Pine Script®מאת NQBA372
CPA 3 PROTitle: CPA 3 PRO: Ultimate Price Action & Liquidity Suite Overview CPA 3 PRO is a comprehensive, all-in-one trading system designed primarily for Crypto markets. It combines classic Price Action concepts with advanced Liquidity Analysis, Volume profiling, and a multi-timeframe scoring system. Unlike simple signal indicators, CPA 3 PRO aggregates over 10 different technical factors to calculate a "Confidence Score" before generating a trade setup. It features a built-in Multi-Symbol Scanner that allows you to monitor the health of 5 different assets simultaneously directly from your chart dashboard. Key Features 1. Confluence Scoring System (The Engine) The indicator uses a point-based system to generate Buy/Sell signals. A signal is only confirmed if the cumulative score exceeds a specific threshold based on your chosen Risk Level. Factors analyzed: Breakouts, EMA Crosses, VWAP position, OBV Trends, MACD Momentum, RSI levels, and Multi-Timeframe trends (4H/1D). Thresholds: You can set the risk to Low, Medium, or High, which adjusts the required points to trigger a signal. 2. Liquidity & Volume Analysis Bid/Ask Spread Monitor: Detects low liquidity periods where slippage might occur. Order Walls: Identifies potential large buy/sell walls based on volume anomalies relative to price movement. Manipulation Detection: Flags "Suspicious Volume" and "Wash Trading" patterns to help you avoid traps. 3. Advanced Risk Management Dynamic SL/TP: Automatically calculates Stop Loss and Take Profit levels based on ATR (Volatility) and Fibonacci levels. View Modes: Choose between ATR-based, Fibonacci-based, or an Average of both for your targets. Risk/Reward Calculation: Displays the potential R/R ratio for every setup. 4. Dashboard & Scanner A sophisticated on-screen table provides real-time data: Scanner: Checks 5 user-defined symbols (default: BTC, ETH, BNB, SOL, ADA) for buy/sell conditions simultaneously. Technical Details: Displays current Breakout status, EMA trends, and OBV direction. Risk Data: Shows entry price, calculated SL/TP levels, and current volatility status. How to Use Select Risk Level: Go to settings and choose your risk appetite (Low/Medium/High). Wait for Confluence: Look for the "STRONG BUY" (Triangle Up) or "STRONG SELL" (Triangle Down) labels. Check the Dashboard: Ensure the Liquidity section is stable (Green). Check the Time Filter (avoid low liquidity hours if you are a scalper). Verify the Signal Power score in the table. Risk Management: Use the displayed SL and TP levels to manage your position. The lines are plotted automatically when a signal is active. Settings Volume Multiplier: Adjust sensitivity for volume spike detection. Risk Level: Filters signals based on the strength of the confluence. Scanner Symbols: Customize the 5 assets you want to monitor in the dashboard. TP Calculation Method: Choose between ATR, Fibonacci, or a mix.אינדיקטור Pine Script®מאת innoalgos11407
stock whisperersdfasow, why your line.new failed: If Pine isn’t exactly v5, TradingView treats line like it doesn’t exist and throws “undeclared identifier”. That’s what you saw. If you still want the fancy extending lines instead of plots, I can give you a version that forces Pine v5. But this one already does what you asked: Shows the levels on top of candles, not in a lower pane. Copy. Paste. Add. Done. If it still breaks, the issue is your TradingView editor, not the code.אינדיקטור Pine Script®מאת Mikespinosa2
BTR Auto Buy/Sell Trend System BTR Auto Buy/Sell Trend System — Your New Profit Machine! Discover the only TradingView system you need to spot powerful trend reversals with precision, confidence, and automation. Designed for Stocks, Crypto & Commodities, this strategy consistently delivers 60%–80% accuracy in trending markets. This is not just a script… 👉 It’s your complete plug-and-play trading system. 💡 Why Traders Love This System ✔ Early Trend Identification Catch major reversals before the crowd. ✔ Non-Repainting Confirmed Signals All entries are triggered only on candle close, so what you see is what you trade. ✔ Smart ATR + Momentum Engine Filters bad trades automatically, giving you only high-quality signals. ✔ Works on All Timeframes From 5-minute scalping to daily swing trading. ✔ Full Auto-Trading Ready Pre-built JSON alerts for API Algo Trading. No coding. No setup headache. Just copy → paste → trade. ⚡ How You Make Money With This Strategy Step 1: Wait for Trend Flip 🔵 BUY when the system flips from bearish → bullish 🔴 SELL when it flips from bullish → bearish Step 2: Enter on Confirmed Signal Trade only on the bar after signal closes. Step 3: Ride the Trend Let the strategy take the move. It avoids sideways markets and shines in strong trends. Step 4: Auto Alerts (Optional) Turn on Dhan alerts and let the system execute trades automatically. 📈 What You Can Expect (Typical Performance) ✔ 60–80% success rate in trending markets ✔ Works in Stocks, Crypto, Commodities ✔ High accuracy in 15m, 30m, 1H, 4H charts ✔ Avoids most fake breakouts & sideways noise This system is built for consistency, simplicity, and scalable automation. ⭐ Perfect For: Beginner traders Algo traders Swing traders Scalpers Systematic API users Anyone who wants clean, high-probability trend signals ⚠ Disclaimer Trading involves risk. Past results do not guarantee future returns. Use proper risk management for best results. אסטרטגיית Pine Script®מאת BK_QuantDesk101039
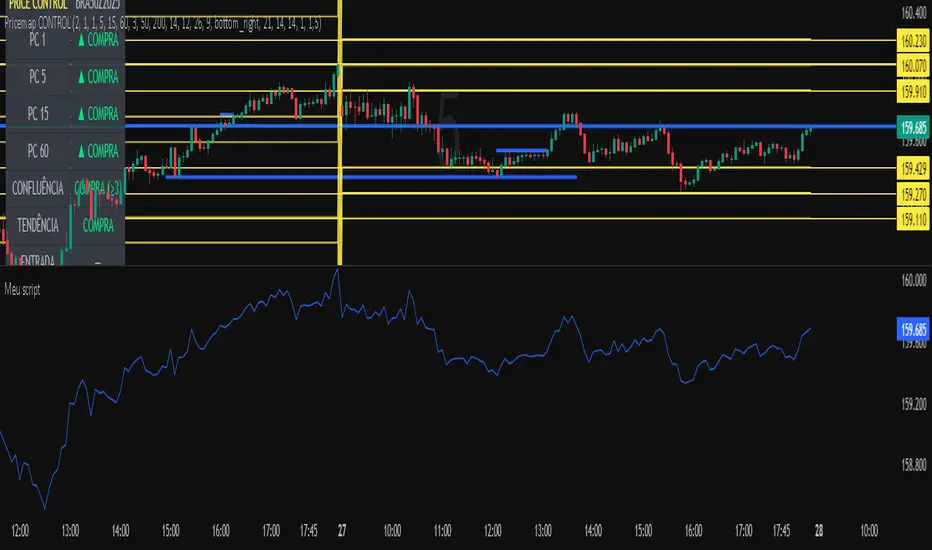
Meu scriptPricemap CONTROL (2, 1, 1, 5, 15, 60, 3, 50, 200, 14, 12, 26, 9, bottom_right, 21, 14, 14, 1, 1,5)אינדיקטור Pine Script®מאת gregoriravanello1
Sniper Entry AU - AYUSHThis indicator combines EMA 9, EMA 15, and VWAP to identify trend direction and intraday strength. EMA 9 and EMA 15 show short-term momentum and crossover signals, while VWAP acts as an institutional reference point for fair value. Together, they help traders spot trend continuation, pullbacks, and high-quality entry zones during intraday sessions.אינדיקטור Pine Script®מאת anuragkumar995696961134